Create 2D Pixel Plot in Python
Last Updated :
08 May, 2021
Pixel plots are the representation of a 2-dimension data set. In these plots, each pixel refers to a different value in a data set. In this article, we will discuss how to generate 2D pixel plots from data. A pixel plot of raw data can be generated by using the cmap and interpolation parameters of the imshow() method in matplot.pyplot module.
Syntax:
matplotlib.pyplot.imshow(X, cmap=None, norm=None, aspect=None, interpolation=None, alpha=None, vmin=None, vmax=None, origin=None, extent=None, shape=, filternorm=1, filterrad=4.0, imlim=, resample=None, url=None, \*, data=None, \*\*kwargs)
Approach:
The basic steps to create 2D pixel plots in python using Matplotlib are as follows:
Step 1: Importing Required Libraries
We are importing NumPy library for creating a dataset and a ‘pyplot’ module from a matplotlib library for plotting pixel plots
import numpy as np
import matplotlib.pyplot as plt
Step 2: Preparing data
For plotting, we need 2-dimensional data. Let’s create a 2d array using the random method in NumPy. Here data1 array is of three sub arrays with no of elements equal to 7, while data2 is an array of four sub-arrays with each array consisting of five elements having random value ranges between zero and one. The random method takes a maximum of five arguments.
data1 = np.random.random((3,7))
data2 = np.random.random((4,5))
We can also import a CSV file, text file, or image.
- Step 2.1: For importing a text file:
data_file = np.loadtxt("myfile.txt")
- Step 2.2: For importing CSV files:
data_file = np.genfromtxt("my_file.csv", delimiter=',')
- Step 2.3: For importing images:
img = np.load('my_img.png')
Step 3: Creating a plot
All plotting is done with respect to an axis. In most cases, a subplot which is an axes on a grid system will fit your needs. Hence, we are adding axes to the plot. Given data will be divided into nrows and ncols provided by the user.
pixel_plot = plt.figure()
pixel_plot.add_axes()
axes = plt.subplots(nrows,ncols)
Step 4: Plotting a plot
For plotting a plot
plt.plot(pixel_plot)
Step 5: Customize a plot:
We can customize a plot by giving a title for plot, x-axes, y-axes, numbers, and in various ways. For the pixel plot, we can add a color bar that determines the value of each pixel. The imshow() method’s attribute named interpolation with attribute value none or nearest helps to plot a plot in pixels. Here cmap attribute for the coloring of the map.
 plt.title("pixel_plot")
 pixel_plot = plt.imshow(pixel_plot,cmap='',interpolation='')
 plt.colorbar(pixel_plot)
Step 6: Save plot
For saving a transparent image we need to set a transparent attribute to value true by default it is false
plt.savefig('pixel_plot.png')
plt.savefig('pixel_plot.png',transparent=True)
Step 7: Show plot:
And finally, for showing a plot a simple function is used
plt.show(pixel_plot)
Below are some examples that depict how to generate 2D pixel plots using matplotlib.
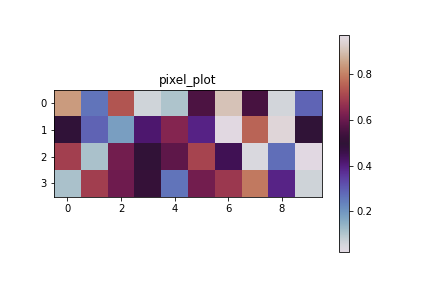
Example 1: In this program, we generate a 2D pixel plot from a matrix created using random() method.
Python3
import numpy as np
import matplotlib.pyplot as plt
data = np.random.random((4, 10))
pixel_plot = plt.figure()
pixel_plot.add_axes()
plt.title("pixel_plot")
pixel_plot = plt.imshow(
data, cmap='twilight', interpolation='nearest')
plt.colorbar(pixel_plot)
plt.savefig('pixel_plot.png')
plt.show(pixel_plot)
|
Output:
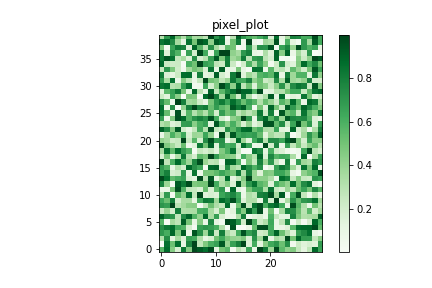
Example 2: In this example, we are taking input of a randomly generated 3D array and generate a 2D pixel plot out of it.
Python3
import numpy as np
import matplotlib.pyplot as plt
data = np.random.random((10, 12, 10))
nrows, ncols = 40, 30
data = data.reshape(nrows, ncols)
pixel_plot = plt.figure()
pixel_plot.add_axes()
plt.title("pixel_plot")
pixel_plot = plt.imshow(
data, cmap='Greens', interpolation='nearest', origin='lower')
plt.colorbar(pixel_plot)
plt.savefig('pixel_plot.png')
plt.show(pixel_plot)
|
Output:
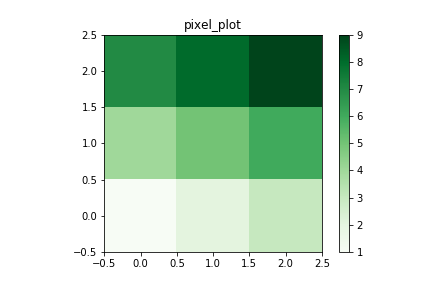
Example 3: In this example, we manually create a 3D array and generate its pixel plot.
Python3
import numpy as np
import matplotlib.pyplot as plt
data = np.random.random((10, 12, 10))
nrows, ncols = 40, 30
data = [[1, 2, 3], [4, 5, 6], [7, 8, 9]]
pixel_plot = plt.figure()
pixel_plot.add_axes()
plt.title("pixel_plot")
pixel_plot = plt.imshow(
data, cmap='Greens', interpolation='nearest', origin='lower')
plt.colorbar(pixel_plot)
plt.savefig('pixel_plot.png')
plt.show(pixel_plot)
|
Output:
Like Article
Suggest improvement
Share your thoughts in the comments
Please Login to comment...