Converting Power Law Distribution to a Linear graph
Last Updated :
06 Jul, 2022
Whenever we are working on ML projects, we have to deal with the high dimensionality of the dataset. There is a very particular term to refer to here i.e. Curse of dimensionality. Although there are many ways to handle this problem one of the solutions can be to change the coordinate systems. This solution is somewhat interesting and new from a data scientist’s perspective. When working on model training we sort of try to remove the linearity of the hypothesis to increase the accuracy of the model. But here in this article, we are trying to understand how to visualize the data easily and can understand it with the help of simple yet innovative maths. Given below is the hypothesis: Power Law is a very important concept in statistics and gives information about two variables. And these two variables are relatively proportional to each other which means that the change in the quantity of one variable will reflect the change in the quantity of other variables. One quantity varies as a power of another. Now lets solve this equation with the help of the natural logarithm (ln).
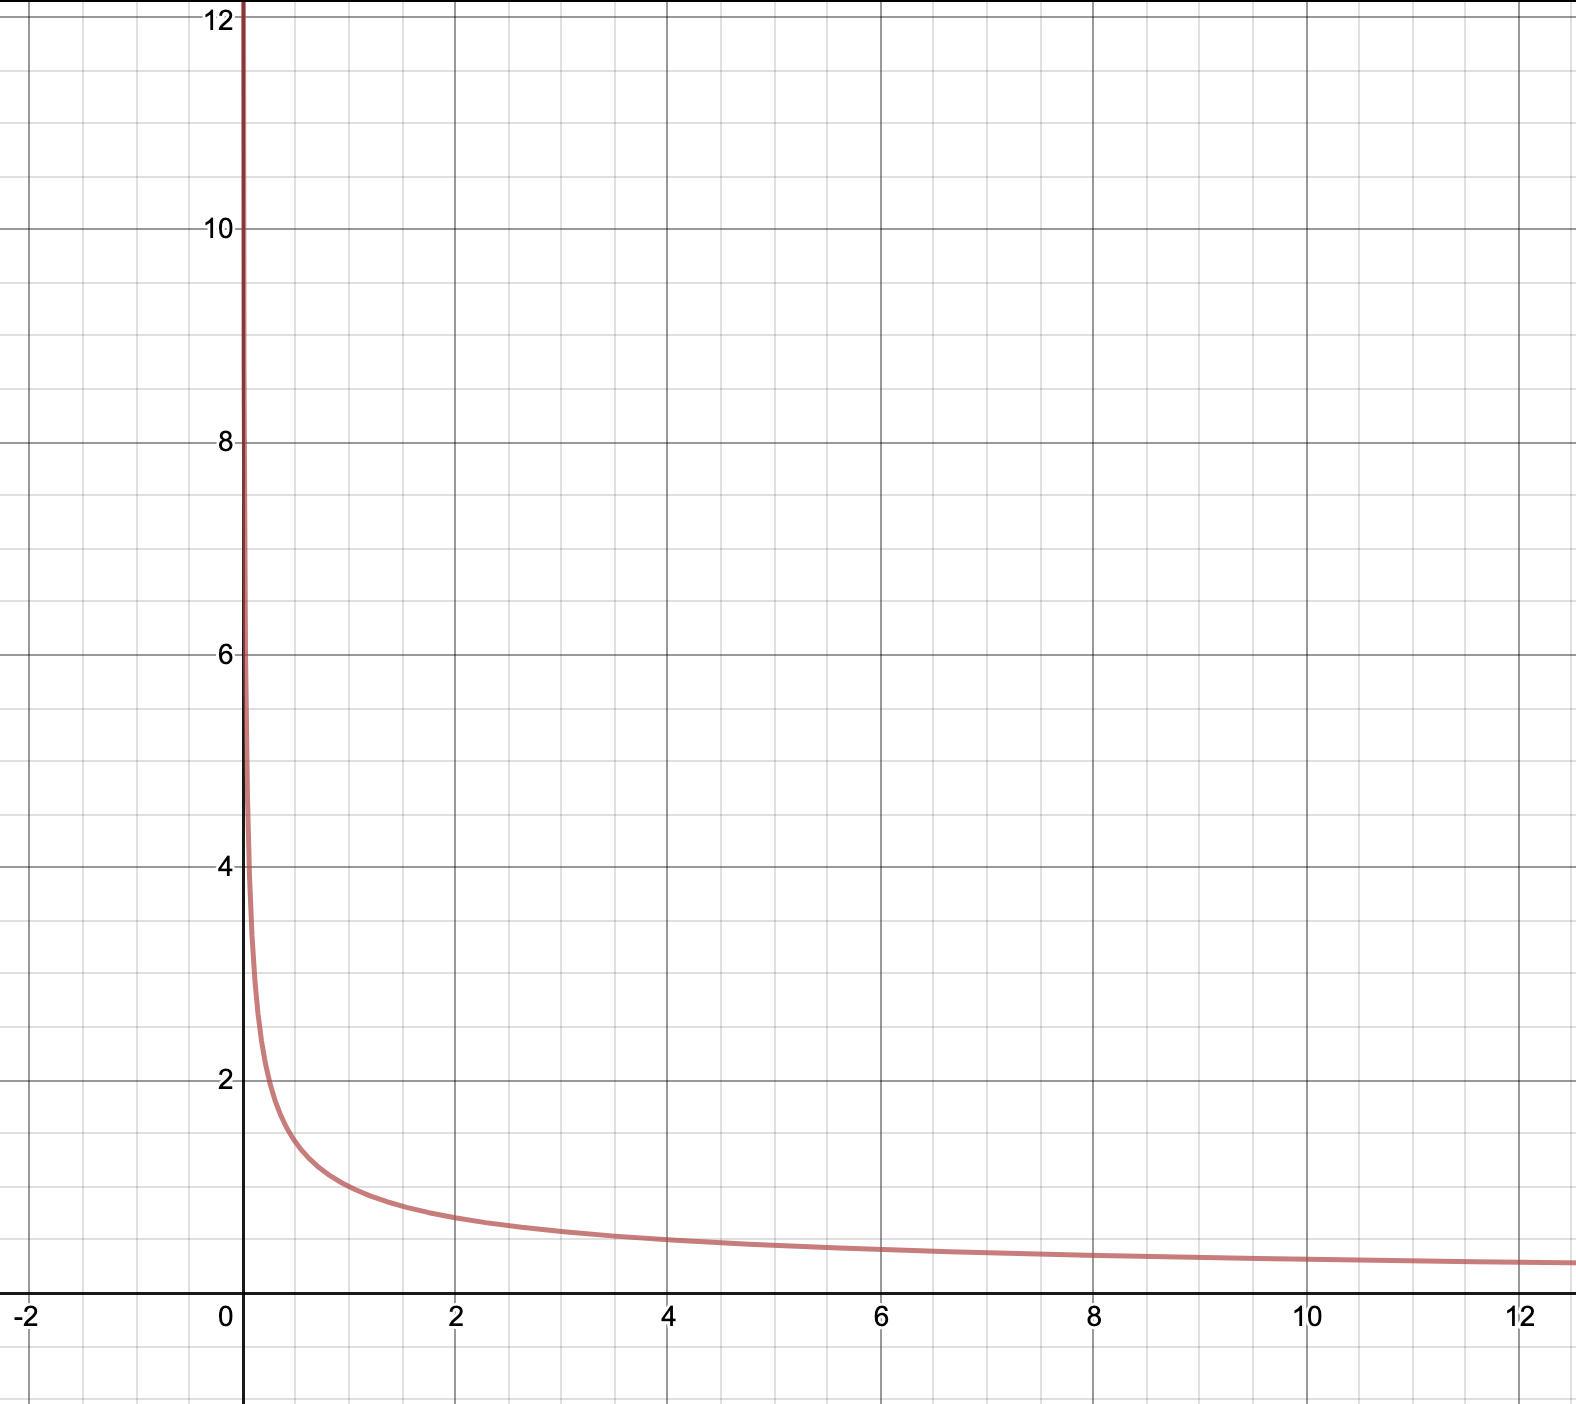
Power Law Graph
 [Tex]\ln (y) = \ln \left(b x^{-a}\right)[/Tex]Using the logarithm property,
 Now, lets assume ln(y) to be
  and ln(x) to be
  . Substituting the values in the equation above and then we have the equation.
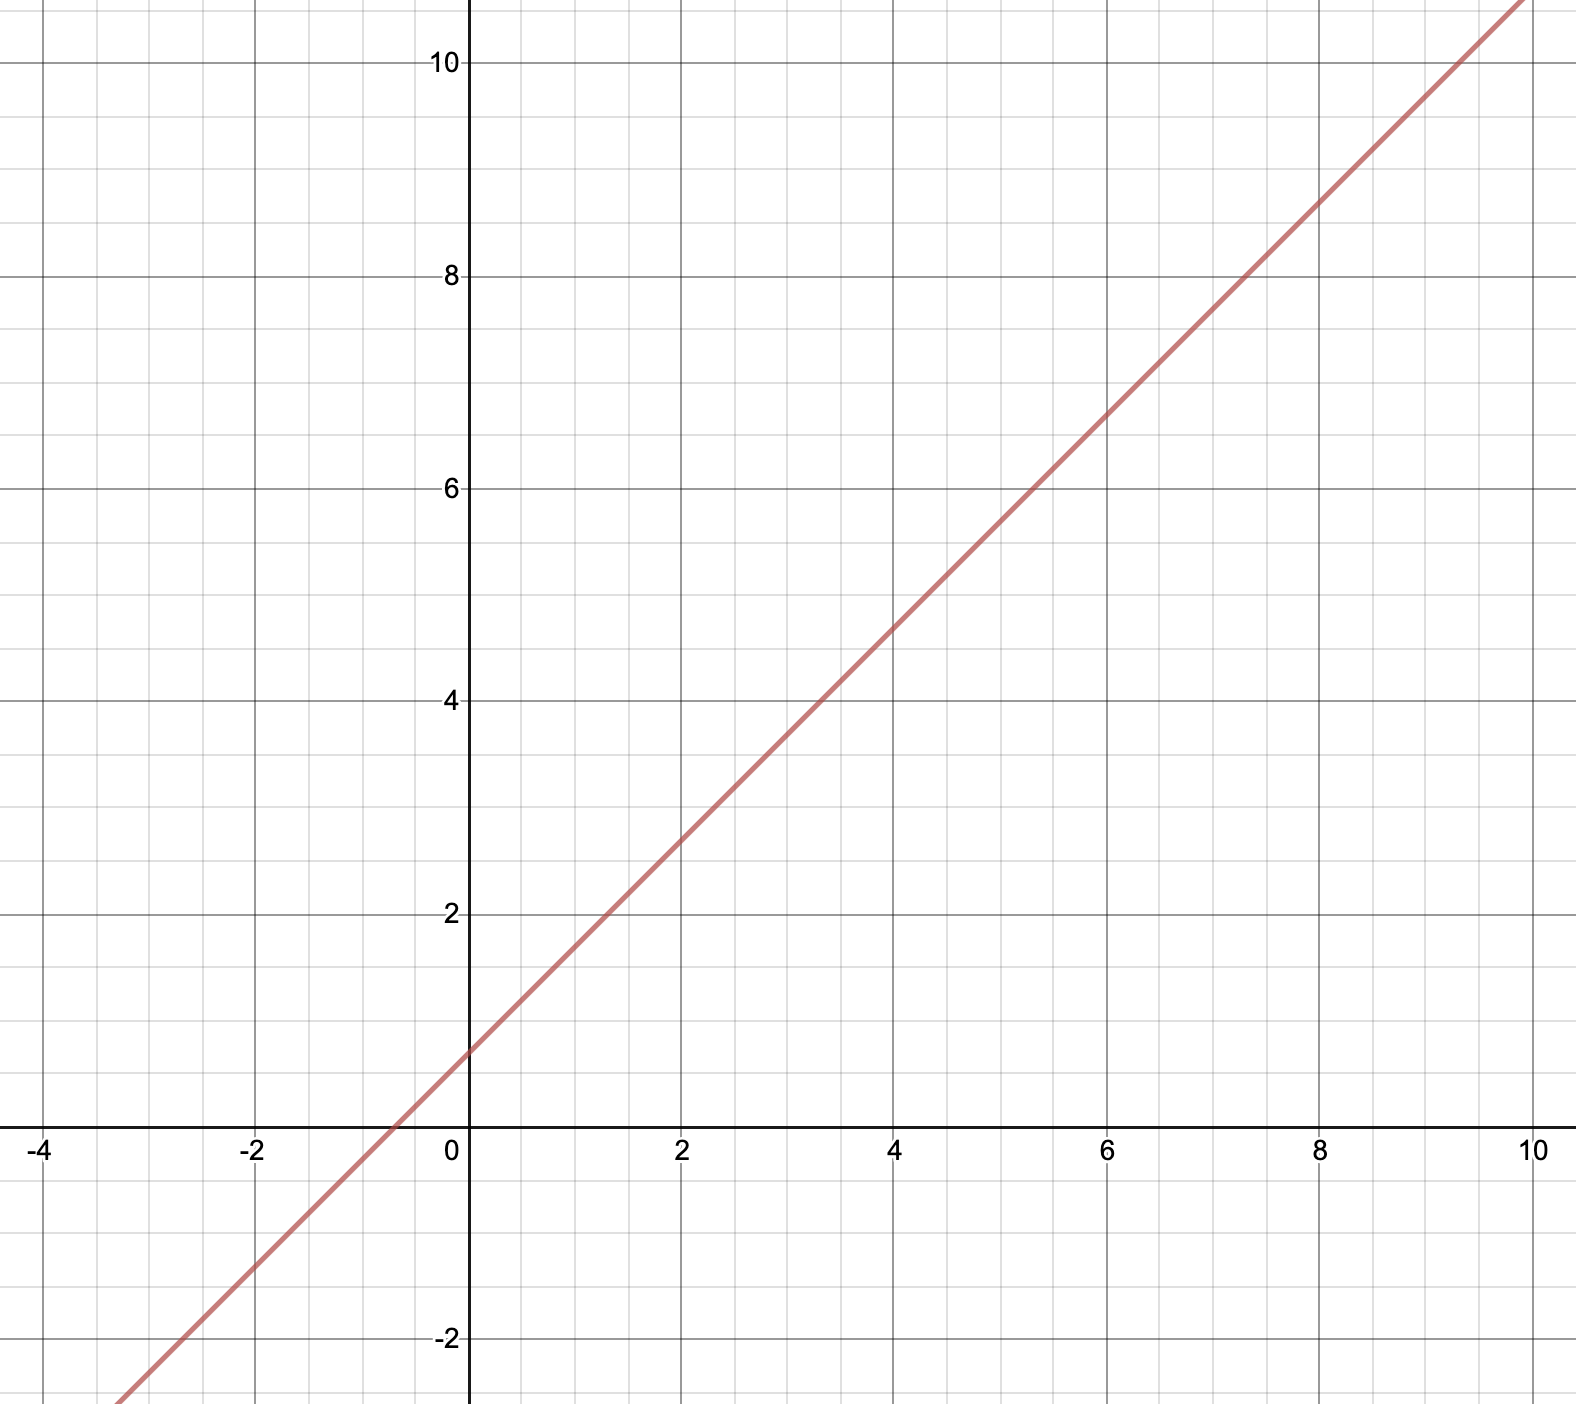
Linear Graph from Power Law Graph
So now, it is very evident that the hypothesis is now been converted to a linear equation. And this will make our task easy to analyse how the parameters are affecting each other.
Like Article
Suggest improvement
Share your thoughts in the comments
Please Login to comment...