Convert covariance matrix to correlation matrix using Python
Last Updated :
08 Oct, 2021
In this article, we will be discussing the relationship between Covariance and Correlation and program our own function for calculating covariance and correlation using python.
Covariance:
It tells us how two quantities are related to one another say we want to calculate the covariance between x and y the then the outcome can be one of these.

where

are the means of x and y respectively.
Interpreting the output:
Either the covariance between x and y is :
Covariance(x,y) > 0 : this means that they are positively related
Covariance(x,y) < 0 : this means that x and y are negatively related
if Covariance(x,y) = 0 : then x and y are independent of each other.
Covariance matrix:
Covariance provides a measure of the strength of correlation between two variable or more set of variables, to calculate the covariance matrix, the cov() method in numpy is used..
Syntax:
ny.cov(m, y=None, rowvar=True, bias=False, ddof=None, fweights=None, aweights=None)
m : [array_like] A 1D or 2D variables. variables are columns
y : [array_like] It has the same form as that of m.
rowvar : [bool, optional] If rowvar is True (default), then each row represents a variable, with observations in the columns. Otherwise, the relationship is transposed:
bias : Default normalization is False. If bias is True it normalize the data points.
ddof : If not None the default value implied by bias is overridden. Note that ddof=1 will return the unbiased estimate, even if both fweights and aweights are specified.
fweights : fweight is 1-D array of integer frequency weights
aweights : aweight is 1-D array of observation vector weights.
Returns: It returns ndarray covariance matrix
Correlation:
It shows whether and how strongly pairs of variables are related to each other. Correlation takes values between -1 to +1, wherein values close to +1 represents strong positive correlation and values close to -1 represents strong negative correlation. It gives the direction and strength of the relationship between variables.
Correlation Matrix:
It is basically a covariance matrix. Also known as the auto-covariance matrix, dispersion matrix, variance matrix, or variance-covariance matrix. It is a matrix in which i-j position defines the correlation between the ith and jth parameter of the given data-set. It is calculated using numpy‘s corrcoeff() method.
Syntax:
numpy.corrcoef(x, y=None, rowvar=True, bias=<no value>, ddof=<no value>)
x : A 1-D or 2-D array containing multiple variables and observations. Each row of x represents a variable, and each column a single observation of all those variables. Also see rowvar below.
y, optional: An additional set of variables and observations. y has the same shape as x.
rowvar : If rowvar is True (default), then each row represents a variable, with observations in the columns. Otherwise, the relationship is transposed: each column represents a variable, while the rows contain observations.
Returns: ndarray
So Why do we need Correlation ?
- Covariance tells us if two random variables are +ve or -ve related it doesn’t tell us by how much.
- Covariance is variant to arithmetic changes eg: if we multiply x by 10 or divide by 10 then the result will change, this is not true for correlation where the results remain unchanged by such operations.
- The output of covariance is difficult to compare as the values can range from – infinity to +infinity. While output values of correlation ranges from 0 to 1.
Relation Between Correlation and Covariance
Correlation is just normalized Covariance refer to the formula below.

where

are the standard deviation of x and y respectively.
Python Program to convert Covariance matrix to Correlation matrix
To solve this problem we have selected the iris data because to compute covariance we need data and it’s better if we use a real word example dataset.
Loading and displaying the dataset
Python3
import numpy as np
import pandas as pd
dataset = pd.read_csv("iris.csv")
dataset.head()
|
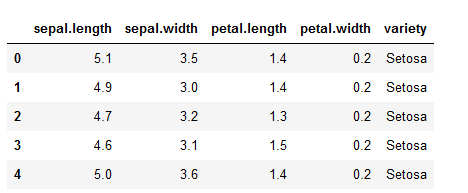
In this example we won’t be using the target column
Python3
data = dataset.iloc[:, :-1].values
|
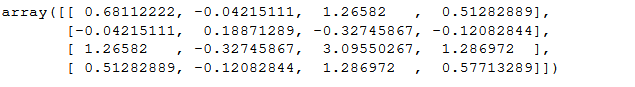
Program to implement covariance matrix:
Python3
def calcCov(x, y):
mean_x, mean_y = x.mean(), y.mean()
n = len(x)
return sum((x - mean_x) * (y - mean_y)) / n
def covMat(data):
rows, cols = data.shape
cov_mat = np.zeros((cols, cols))
for i in range(cols):
for j in range(cols):
cov_mat[i][j] = calcCov(data[:, i], data[:, j])
return cov_mat
covMat(data)
|
Output :

Numpy cov() output :
Python3
np.cov(data,rowvar=False)
|
note : the rowVars needs to be make false otherwise it will take the rows as features and columns and observations.
Output:
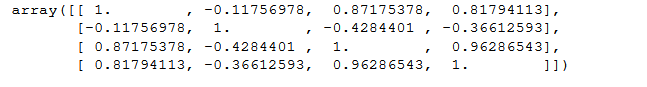
Calculating Correlation:
In this function, we are going to convert the Covariance matrix to correlation.
Python3
def corrMat(data):
rows, cols = data.shape
corr_mat = np.zeros((cols, cols))
for i in range(cols):
for j in range(cols):
x, y = data[:, i], data[:, j]
corr_mat[i][j] = calcCov(x, y) / (x.std() * y.std())
return corr_mat
corrMat(data)
|
Output:
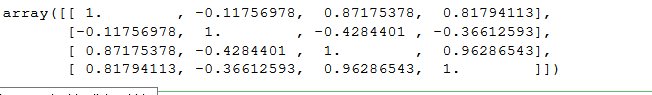
The corrcoef() in numpy can also be used to compute the correlation.
Python3
np.corrcoef(data,rowvar=False)
|
Output:
Share your thoughts in the comments
Please Login to comment...