Control Point Border Thickness in ggplot2 in R
Last Updated :
17 Jun, 2021
In this article, we will be looking at the approach to control point border thickness in the ggplot2 plot in the R programming language.
In this method to control the point border thickness in ggplot2, the user first needs to install and import the ggplot2 package in the R console and then call the geom_point() function with the addition of the ggplot() function, this will let the user control color, thickness, size and many more properties of the points, and specify the argument stroke which will be controlling the border thickness of the point to an integer value greater than 1 to increase the point’s border thickness and the integer value 1 is the default value of the stroke argument of the geom_point() function of ggplot2 in the R programming language.
geom_point() function is used to create a plot with points or scatterplot.
Syntax:
geom_point( mapping = NULL, data = NULL, stat = “identity”, position = “identity”, …, na.rm = FALSE, show.legend = NA, inherit.aes = TRUE,stroke)
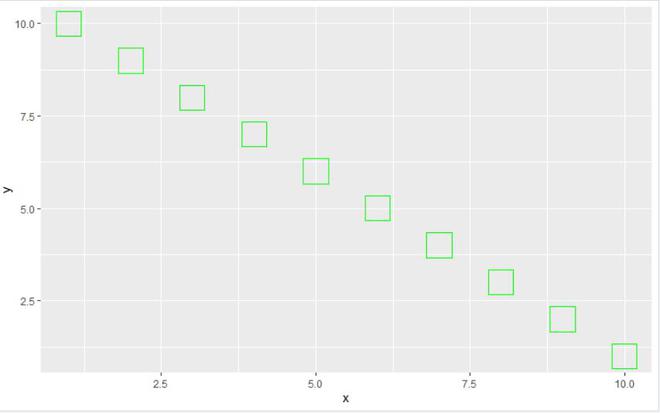
Let us see how the original plot will appear so that the difference is apparent.
Example:
R
library("ggplot2")
gfg_data<-data.frame(x=c(1,2,3,4,5,6,7,8,9,10),
y=c(10,9,8,7,6,5,4,3,2,1))
ggplot(gfg_data, aes(x, y)) + geom_point(
color = "green", size = 10, shape =0)
|
Output:
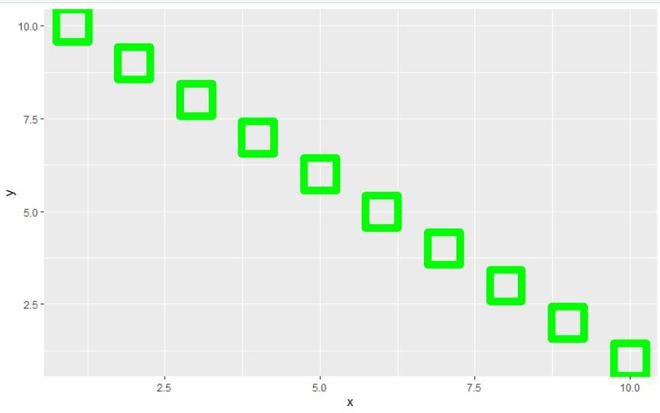
Now let us see the same plot with an increased border size.
Example:
R
library("ggplot2")
gfg_data<-data.frame(x=c(1,2,3,4,5,6,7,8,9,10),
y=c(10,9,8,7,6,5,4,3,2,1))
ggplot(gfg_data, aes(x, y)) + geom_point(
color = "green", size = 10, shape =0,stroke=5)
|
Output:
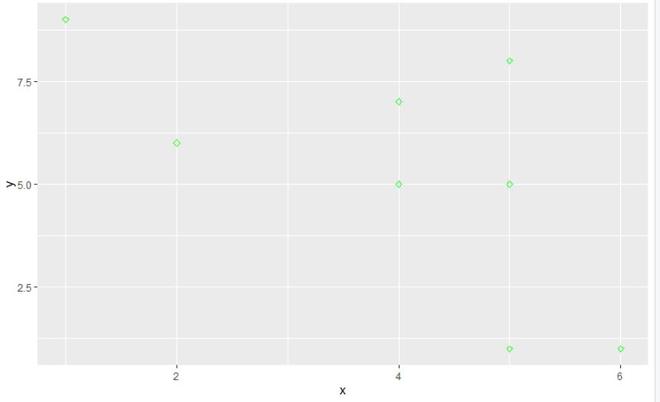
In this example, we will be increasing the border thickness of the rhombus shape point on the ggplot2 plot using the stroke argument of the geom_point() function.
Let us look at the original plot so that the difference can be apparent.
Example:
R
library("ggplot2")
gfg_data<-data.frame(x=c(5,4,5,2,5,4,6,1),
y=c(1,5,5,6,8,7,1,9))
ggplot(gfg_data, aes(x, y)) +
geom_point(color = "green", shape =5)
|
Output:
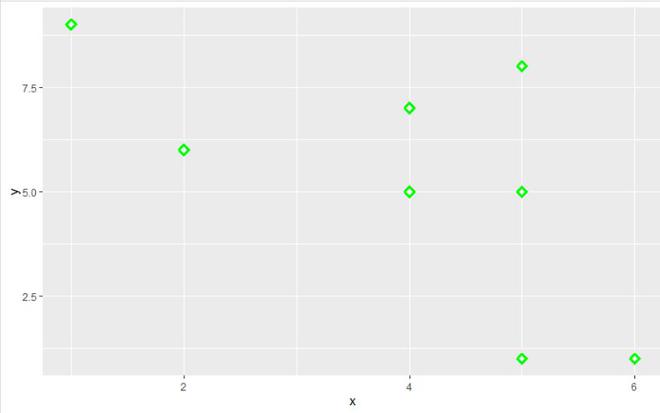
Now let’s visualize the same plot with an increased border thickness.
Example:
R
library("ggplot2")
gfg_data<-data.frame(x=c(5,4,5,2,5,4,6,1),y=c(1,5,5,6,8,7,1,9))
ggplot(gfg_data, aes(x, y)) +
geom_point(color = "green", shape =5,stroke=2)
|
Output:
Like Article
Suggest improvement
Share your thoughts in the comments
Please Login to comment...