Concept of Variable and Raw Data
Last Updated :
21 Dec, 2023
The data collected by an investigator is in raw form and cannot offer any meaningful conclusion; hence, it needs to be organized properly. Therefore, the process of systematically arranging the collected data or raw data so that it can be easy to understand is known as the organization of data. With the help of organized data, it becomes convenient for the investigator to perform further statistical treatments. The investigator can also compare the mass of similar data if the collected raw data is organized systematically.
Variable
Variable is a term derived from the word ‘vary’, meaning ‘to change’ or ‘to differ’. Therefore, variables are the characteristics that change or differ. A variable refers to the quantity or characteristic whose value varies from one investigation to another. The difference in the value of a variable may be with respect to a place, item, individual, or time, and each value within this range is known as Variate.
For example, Quantity is a variable as different commodities have different quantities. Similarly, Price, Age, Weight, Height, Income, Production, etc., are also variables. Different variables are measured in different units, such as quantity is measured in units or tonnes, etc., height in centimeters or inches, age in years, etc.
Variables are of two kinds Discrete Variable (Discontinuous Variable) and Continuous Variable.
1. Discrete Variable (Discontinuous Variable)
Discrete variables are the variables that take only exact values and not fractional values. In simple terms, the variables which are expressed in terms of complete numbers are known as discrete variables. For example, the number of teachers in a school is a discrete variable, as they cannot be expressed in fractions. The data of discrete variables is collected through counting.
Example
The data collected of the number of workers in different teams of a company in discrete variables can be shown as:

2. Continuous Variable
Continuous variables are the variables that can take every possible value whether it is integral or fractional, in a specified given range. For example, the height of an individual can be in decimals or in exact numbers within the specified range. The data of continuous variables is collected through measurement.
Example
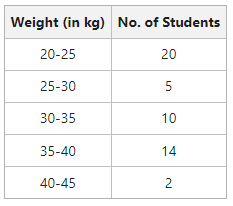
The data collected on the height of students in a class in continuous variables can be shown as:
Discrete Variable v/s Continuous Variable

|
Meaning
|
Discrete variables are the variables that take only exact values and not fractional values. |
Continuous variables are the variables that can take every possible value whether it is integral or fractional in a specified given range. |
|
Change in Values
|
The value of discrete variables increases in complete numbers. |
The value of continuous variables can increase in complete numbers as well as in fractions. |
|
Data Collection
|
The data is collected by counting in the case of a discrete variable. |
The data is collected by measurement in the case of a continuous variable. |
|
Example
|
The number of students in a college is a discrete variable as they cannot be expressed in fractions. |
The height of students in a class is a continuous variable as they can be measured in numbers as well as in fractions. |
Raw Data
Raw data is the mass of data in its crude form. In other words, the unorganized mass of different items, which are yet to be organized by an investigator is known as raw data. For example, the raw data of the weight of 40 students in a class can be expressed as follows:

The data presented in the above table is raw data. An item (say 55, i.e., weight, in the above example) is known as a value, measure, observation, magnitude, or item, etc. No meaningful conclusion can be drawn from this data as it is in crude form, and hasn’t been classified into different categories/classes. As only that data is useful for an investigator which is homogeneous, the raw data is of no use in Statistics, unless it is converted into some classes or statistical series. To do so, an investigator has to first organize the data, and classify them in the form of series.
Series means the data which are presented by the investigator by converting the raw data in some sequence or order. In other words, arranging data in different classes according to a given order is known as a series. For example if in the above case, the weight of the students is arranged, according to their roll numbers, in a specific order (ascending or descending order), then the arranged data will be known as Statistical Series.
According to Horace Secrist, “A series as used statistically may be defined as things or attributes of things arranged according to some logical order.“
Like Article
Suggest improvement
Share your thoughts in the comments
Please Login to comment...