Compute the Value of Poisson Density in R Programming – dpois() Function
Last Updated :
04 Jan, 2022
dpois() function in R Language is used to compute the Poisson Density for a set of Integer values. It also creates a density plot of poisson distribution.
Syntax: dpois(vec, lambda)
Parameters:
vec: Sequence of integer values
lambda: Average number of events per interval
Example 1:
Python3
x <- seq(-10, 10, by = 1)
y <- dpois(x, lambda = 5)
y
|
Output:
 [1] 0.000000000 0.000000000 0.000000000 0.000000000 0.000000000 0.000000000
 [7] 0.000000000 0.000000000 0.000000000 0.000000000 0.006737947 0.033689735
[13] 0.084224337 0.140373896 0.175467370 0.175467370 0.146222808 0.104444863
[19] 0.065278039 0.036265577 0.018132789
Example 2:
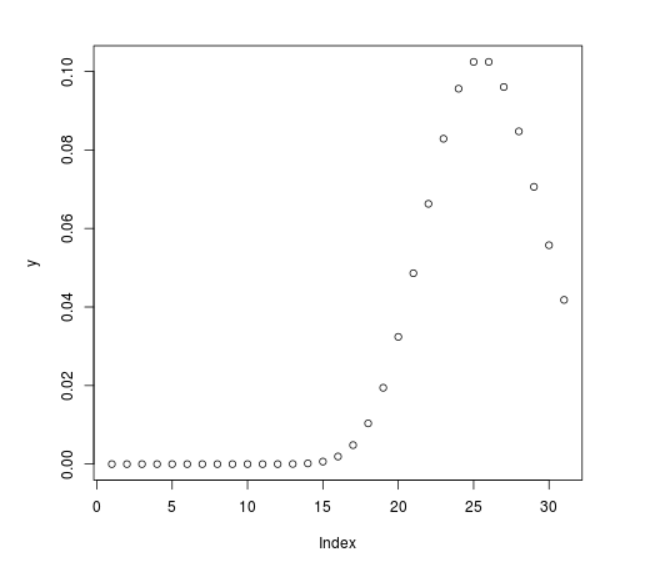
Python3
x <- seq(-10, 20, by = 1)
y <- dpois(x, lambda = 15)
plot(y)
|
Output:
Like Article
Suggest improvement
Share your thoughts in the comments
Please Login to comment...