Compute the value of F Cumulative Distribution Function in R Programming – pf() Function
Last Updated :
25 Jun, 2020
pf() function in R Language is used to compute the density of F Cumulative Distribution Function over a sequence of numeric values. It also plots a density graph for F Cumulative Distribution.
Syntax: pf(x, df1, df2)
Parameters:
x: Numeric Vector
df: Degree of Freedom
Example 1:
x <- seq(1, 30, by = 2)
y <- pf(x, df1 = 2, df2 = 3)
y
|
Output:
 [1] 0.5352420 0.8075499 0.8891420 0.9258675 0.9460051 0.9584308 0.9667275
 [8] 0.9725899 0.9769124 0.9802073 0.9827867 0.9848509 0.9865331 0.9879255
[15] 0.9890935
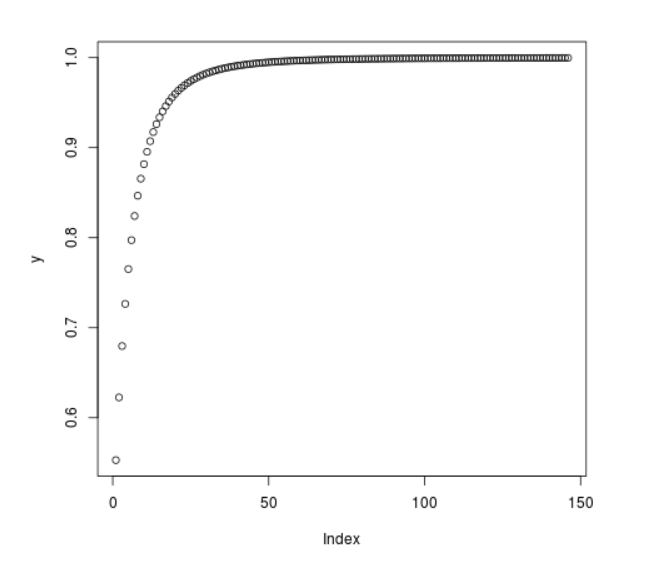
Example 2:
x <- seq(1, 30, by = 0.2)
y <- pf(x, df1 = 3, df2 = 7)
plot(y)
|
Output:
Like Article
Suggest improvement
Share your thoughts in the comments
Please Login to comment...