Compute the value of CDF on Uniform Distribution in R Programming – punif() Function
Last Updated :
03 Jul, 2020
In R programming, punif() function is used to compute the value of Cumulative Distribution Function(CDF).
Syntax:
punif(q, min = 0, max = 1, lower.tail = TRUE, log.p = FALSE)
Parameters:
q: represents vector of quantiles
min, max: represents lower and upper limits of the distribution
lower.tail: represents logical value. If TRUE, probabilities are P[X<=x]
log.p: represents logical value. If TRUE, probabilities are given as log(p)
Example 1:
u <- runif(20)
punif(u) == u
print(punif(u))
|
Output:
 [1] TRUE TRUE TRUE TRUE TRUE TRUE TRUE TRUE TRUE TRUE TRUE TRUE TRUE TRUE TRUE
[16] TRUE TRUE TRUE TRUE TRUE

[1] 0.21571509 0.97224483 0.74654757 0.93053902 0.90868119 0.93048128
 [7] 0.41566382 0.52074950 0.41353715 0.48460207 0.63706965 0.16338451
[13] 0.22761876 0.54239105 0.07045675 0.04363406 0.68484316 0.86928257
[19] 0.06046589 0.29565811
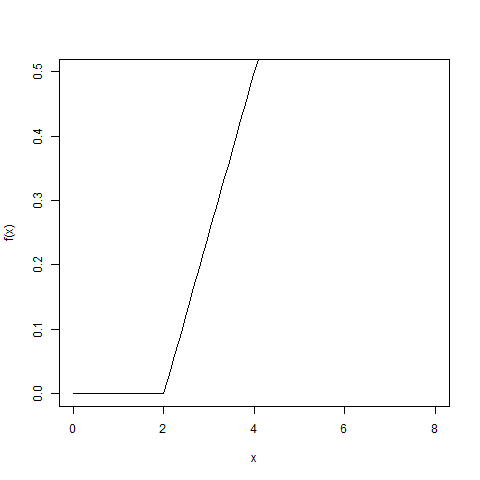
Example 2:
png(file = "punifGFG.png")
curve(punif(x, min = 2, max = 6), 0, 8, ylim = c(0, 0.5),
ylab = "f(x)")
dev.off()
|
Output:
Share your thoughts in the comments
Please Login to comment...