Compute the value of Cauchy Quantile Function in R Programming – qcauchy() Function
Last Updated :
25 Jun, 2020
qcauchy() function in R Language is used to calculate the value of cauchy quantile function. It also creates a density plot of cauchy quantile function.
Syntax: qcauchy(vec, scale)
Parameters:
vec: x-values for cauchy function
scale: Scale for plotting
Example 1:
x <- seq(0, 1, by = 0.2)
y <- qcauchy(x, scale = 4)
y
|
Output:
[1] -Inf -5.505528 -1.299679 1.299679 5.505528 Inf
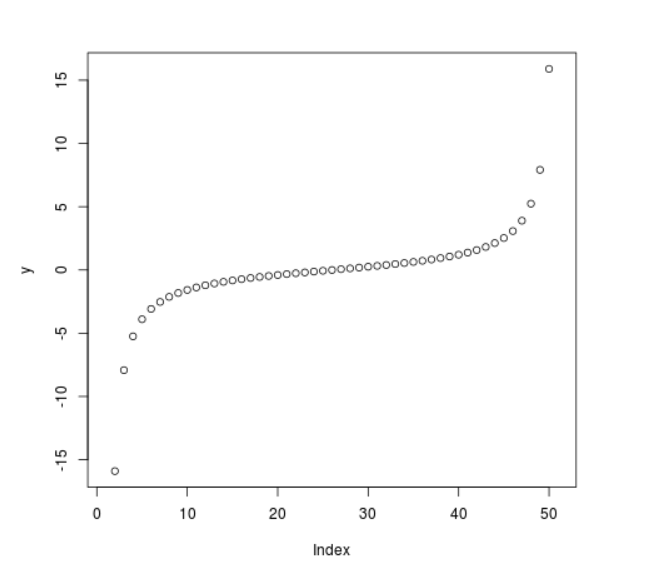
Example 2:
x <- seq(0, 1, by = 0.02)
y <- qcauchy(x, scale = 1)
plot(y)
|
Output:
Like Article
Suggest improvement
Share your thoughts in the comments
Please Login to comment...