Compute Cauchy Density in R Programming – dcauchy() Function
Last Updated :
25 Jun, 2020
dcauchy() function in R Language is used to calculate the cauchy density. It also creates a density plot of cauchy distribution.
Syntax: dcauchy(vec, scale)
Parameters:
vec: x-values for cauchy function
scale: Scale for plotting
Example 1:
x <- seq(1, 10, by = 1)
y <- dcauchy(x, scale = 5)
y
|
Output:
 [1] 0.06121344 0.05488101 0.04681028 0.03881828 0.03183099 0.02609097
 [7] 0.02150742 0.01788258 0.01501462 0.01273240
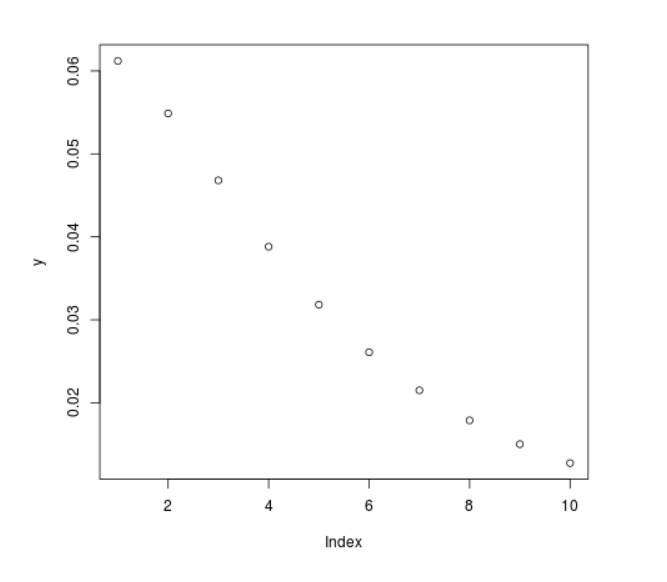
Example 2:
x <- seq(1, 10, by = 1)
y <- dcauchy(x, scale = 5)
plot(y)
|
Output:
Like Article
Suggest improvement
Share your thoughts in the comments
Please Login to comment...