Alteryx was recognized as a leader in Gartner’s 2018 magic quadrant for data science and machine learning platforms Gartner specifically recognized alteryx as the leader with the highest ability to execute on its vision alteryx. Alteryx’s easy to use solutions address the needs of a wide range of problem solvers from citizen data scientists to highly trained business analysts, the alteryx platform offers customers both a code-free and code-friendly approach, hundreds of automation building blocks and the ability to integrate with enterprise applications and robotic process automation or rpa to automate machine learning pipelines and business processes.,
What is Alteryx
Alteryx is an end-to-end data analytics platform that allows users to prep, blend and analyze data in a drag and drop user interface. Drag and drop means that you can directly drag any tool or dataset directly into your workspace.
Now you might be wondering how this differs from programs that you might already be using such as excel and several other spreadsheet programs, well adding data sources to excel requires manual copy paste and repeat tasks, this is also true for data cleansing. Automation of this repetitive work is possible but you have to learn some programming language coding. In alteryx you can add repeatable processes by dragging and dropping tools into your workflow, this workflow can then be automated or scheduled to run on a regular basis which saves a lot of time, excel is also limited to just one million rows so anything greater than that would have to be put into a separate file while in alteryx a large amount of data can be utilized and it has more than 70 different types of needed data connectors or tools as well as an assortment of APIs.
Let’s take a look at the basic structure of the platform
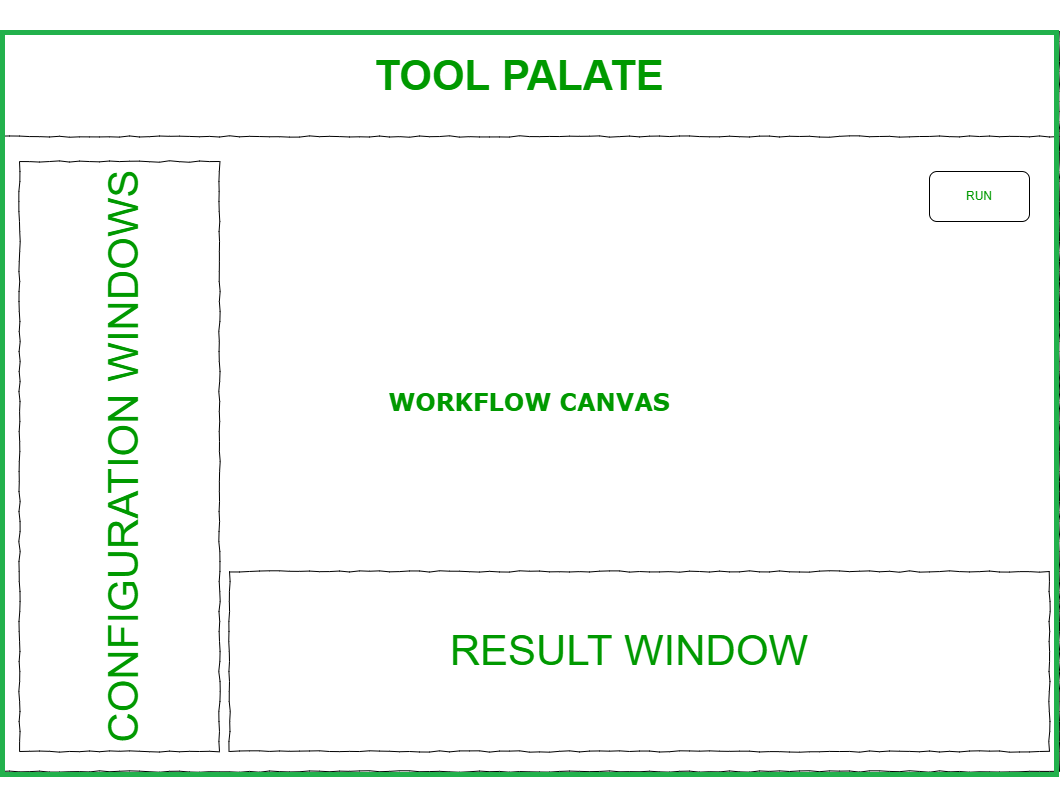
User Interface – Alteryx
On the top, you can see the tool palette where all the tools reside and from here you can drag and drop tools to the workflow canvas which is an empty space to create your workflow, on the left-hand side you can see the configuration window which displays the configuration for either a selected tool, a connection or the workflow itself if you do not select anything else below we have the results window it shows us the state of the data as the workflow runs and it displays any messages warnings or errors that can occur, it also gives us links to the output file that is created. To run our workflow we can click on the run button on the upper right portion of the canvas or press control plus R (ctrl+R) on our keyboard or click on the options then run the workflow, this will start the flow to data from the input tools to the tools you have configured on the canvas, an important point to note here is that running a workflow will not change anything on your original file input unless we overwrite it using an output data tool moreover tools won’t do anything to your data unless you configure them first.
Each tool has a different configuration and if not configured properly it will display a red exclamation mark on the tool icon which is an indicator for us that it needs further action. In this window the first icon with a screw contains the tool configuration that we have discussed while the next one with the pointed arrow is the navigation which shows us which tools are connected to the selected tool that we have, we can also hide or show their connections by selecting or deselecting the wireless checkbox the tab icon shows us the annotation settings for the tool, here we can name the tool and type annotation or caption of each tool the annotation can also be shown based on canvas setting always show or never show the last icon in the window leads us to the help page of alteryx, it has the complete documentation regarding the selected tool.
Once you are done with the workflow you can save it by navigating to the File menu and variable-length then hitting save your workflow will be saved in your designated file path as a dot yxmd file which saves the whole workflow including the tools used you can also export your workflow by clicking on options then export workflow this will save your file as a yxzp which is an alteryx package that contains your workflow yxmd, as well as any assets, used such as the input files that you have in your workflow this will be useful if you are sharing your work to others in your organization. Now we’re going to dive into the detail of these various areas let’s head on to the different data types that alteryx supports
Alteryx processes values differently depending on their data type and here are the five main types of data
| NO |
Data Type |
Description |
| 1 |
String |
This is plain text such as names places and descriptions |
| 2 |
Alphanumeric |
Contain symbols next are the numerics they can contain numerical values that can range from negative numbers to positive numbers and also exponential numbers |
| 3 |
Date & Time |
Contain the date or the time format |
| 4 |
Boolean |
Contain either one for true or zero for false this data type is usually used for flagging the data for example a customer can either be subscribed as a member wherein the value is 1 or if not it’s 0. |
| 5 |
spatial Object |
This data type contains objects such as blobs, centroids and polygons this can also be an image or sound file the underscore string and the underscore w string are both variable lengths meaning that they can both adjust the length of the field to accommodate the entire string within the field the underscore w string will accept any character including white format and Unicode variable-length characters it’s also a great catch-all field type if you are not sure of the format of your incoming data we have several different numeric data types the smallest is byte which can only accommodate small hold numbers up to 255 or 8 bits in size next are the integers in int 16 int 32 or int 64 which all take full numbers wherein their size is indicated on their names 16 32 64 bits respectively. |
We check for these data types in alteryx when bringing in data, a lot of users use the select tool to check data type and structure, to add a select tool click on the preparation toolset then click on the select tool and drag it to the canvas a dotted line will show that you can attach it to the nearby input data tool and it will become a straight line once you let go of the tool once done alteryx can now show you the list of available fields from the connected data through this configuration window this shows the data type for each column and its size.
All of this just was just an introduction to alteryx now we can cover tool wise:
Internal/Outdoor Tools
They are used to access data from places like your desktop, website, cloud,take etc.
Data Input Tool
In most cases, this will be where your workflow starts. I like to think of you as the door you will open to allow your data to enter Alteryx. Data can be in various formats like xls, csv, jason, xml, tab and many more.
Data Output Tool
If “Input Data” was the door to allow your data to go into the workspace, “Output Data” is a locked door that will end the Alteryx process. Goodbye to your work trip! Your data is now ready for use.
Preparation Tools
Blue tools are designed to assist the data processing process for analysis. Instead of worrying about SQL encoding in our Excel formulas you only need to drag and drop tools within the workflow.
Filter
Basically, the filter allows you to split your data into two streams: records that satisfy your speech (True) and records that do not (False). You can access both broadcasts afterward, but as a good practice, it is recommended to construct a sentence in such a way that the response you want will be on the “true” side.
Select Tool
It looks like a filter in a sense, once it re-runs within the columns, however, instead of a dialog that may result in a true or false answer, here you can select and edit your fields. It is useful to rename, resize, resize data, and more.
Formula Tool
Allows you to create or update fields in different ways. For example, we used formulas to calculate the number of columns in a file, to create a new column with a total of two more columns.
Multi-Line Formula Tool
This tool allows you to create or update lines in one field. Today we have used it to fill in the “blank” values in a column with US regions, making regions appear in every row.
Join Tools
These are the tools used to integrate different data sources.
Union Tool
Used to combine two or more data streams in the same format (same columns), but different data. The result will be a file with all your information both streaming together.
Parse And Transform Tools
They help to rearrange and reshape data into the required format for analysis.
Transpose Tool
This converts horizontal fields into vertical fields.
Crosstab Tool
This does the opposite of the transpose tool: it turns vertical fields into horizontal fields.
Text to Column Tool
Divides text from one place into separate rows or columns. It is useful if you have words in a comma-separated line, for example, and would like to split them into a new column.
Regex Tool
With this tool, you can analyze, match or modify data using common expressions. For example, when analyzing Twitter data we needed to remove punctuation marks. In this case, we have created a simple saying that instructs Alteryx to keep only the letters, “@” and “#”. In this way, we store words, hashtags, and users and remove thoughts like stops, ellipsis, exclamations, and question marks.
Apart from these, there are many tools that help you in data analytics and visualization.
The best way to learn alteryx is to start practicing and make workflows which is the only thing that will help you understand it completely.
Making a workflow
Now let’s try to visualize making a workflow let’s start by adding an input data to our canvas click on the in slash out tool category and drag the input tool to the canvas this tool will bring in a file or a database connection to our workflow to add a file click on the arrow on the configuration window this will open a data connections window that shows you the recent files you have used your saved data the file data sources and gallery both the file and data sources tab lists all the types of files and data connections supported by alteryx to add a file you can click on select a file and navigate to a file in your data folder or drag and drop a file from your file explorer if you choose an excel file it will direct you to a window where you can either select a sheet and or specify a range of cells that you need or you can import the sheet names only since we will use the data inside the sheet we selected the latter click on OK to apply ,the options section will be different for each file type unless you specify how the file will be read.
On an excel file, we first have the record limit you can add a specific number of rows if you only want a sample of that data the file format is the table or query, in this case, it contains our sheet name search sub-directories in only used if you are importing multiple files from a certain path, output file name as file adds the name of your file or your whole file path to your data first row contains data is for files that do not contain the header and the indicated row where you want to start the data import from the preview box below contains the first 100 records which can be fewer for wider files to review the complete data let’s add in a browsing tool the data will be shown in the results window once we run the workflow, on the results window you have a count of row records and the size of the data
if you only wanted to see select fields you can show or hide them by selecting the field on the upper left of the window, you can also view the contents of a cell on the cell viewer and show if it has white space, you can also save this data as a new file by clicking on the save icon or copy it by clicking on the copy button
Data Quality
The metadata type shows the type size and source of each field column in your data set, a colon data quality bar displays at the top of each column of data in the results window red not okay the column contains values with leading or trailing white space yellow null the column contains no values gray empty the column contains strings with no values and green OK, the column contains values without leading or trailing white spaces if you wanted to check the data for a specific value type it in the search bar on the upper right and hit enter all rows associated with that value on one of their fields will be shown you can also sort and filter individual columns to do so click on the three dots on the field name and click on either filter or sort these filter and sort changes will not be a permanent step on your workflow unless you apply the tools to the canvas this will add in the filter or sort tool with the appropriate configurations that you have applied using the browse tool also allows you to look at the data profile of each column this is available in the browse configuration window if you haven’t selected any fields from the browse window it will show a tabular list of top occurring values of each column including the numbers of instances where it was available on the data selecting a specific field in the browse window will give you more insight on the column the information will vary depending on the data type of the column.
Conclusion
In our example, we have a numeric field the first chart contains the data quality summary of the field showing if a certain percentage of it has null empty or trailing white space the next chart has the value statistics of the field the bar chart has the grouped range of available data and shows which range has more recurring values since this is a numeric value it also shows us some simple statistical values such as the minimum, maximum and average value of the data lastly is a list of top values let’s take a look at a string field and see its profile difference we still have the same data quality chart but we have a bit of a difference on the statistical chart instead this makes use of the length of the strings and shows the shortest and longest value that it has and also has the first numeric value and the last it also shows a value chart with the most frequent value.
Another way of adding in data to alteryx is via text input; it allows you to create a new stream of data without using a file or a database you can manually type in data from the configuration box.
Every tool gives you a brief explanation and an attached example if you click on it. All this information is more than sufficient to start using alteryx. Furthermore, the Alteryx community has a wide variety of already solved issues which are very beneficial, and learning a tool like this would definitely help you to kick start your data science career.
Share your thoughts in the comments
Please Login to comment...