Complete Graph using Networkx in Python
Last Updated :
24 Jan, 2023
A complete graph also called a Full Graph it is a graph that has n vertices where the degree of each vertex is n-1. In other words, each vertex is connected with every other vertex.
Example: Complete Graph with 6 edges:
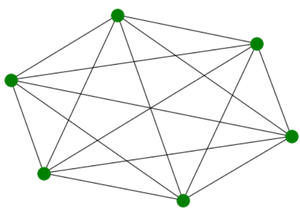
C_G6
Properties of Complete Graph:
- The degree of each vertex is n-1.
- The total number of edges is n(n-1)/2.
- All possible edges in a simple graph exist in a complete graph.
- It is a cyclic graph.
- The maximum distance between any pair of nodes is 1.
- The chromatic number is n as every node is connected to every other node.
- Its complement is an empty graph.
We will use the networkx module for realizing a Complete graph. It comes with an inbuilt function networkx.complete_graph() and can be illustrated using the networkx.draw() method. This module in Python is used for visualizing and analyzing different kinds of graphs.
Syntax: networkx.complete_graph(n)
Parameters:
- N: Number of nodes in complete graph.
- Returns an networkx graph complete object.
- Nodes are indexed from zero to n-1.
Used to realize the graph by passing graph object.
networkx.draw(G, node_size, node_color)
Parameters:
- G: It refers to the complete graph object
- node_size: It refers to the size of nodes.
- node_color: It refers to color of the nodes.
Approach:
- We will import the required module networkx.
- Then we will create a graph object using networkx.complete_graph(n).
- Where n specifies n number of nodes.
- For realizing graph, we will use networkx.draw(G, node_color = ’green’, node_size=1500)
- The node_color and node_size arguments specify the color and size of graph nodes.
Example 1:
Python3
import networkx
G = networkx.complete_graph(6)
networkx.draw(G, node_color = 'green',
node_size = 1500)
|
Output:
Output
The output of the above program gives a complete graph with 6 nodes as output as we passed 6 as an argument to the complete_graph function.
Example 2:
Python3
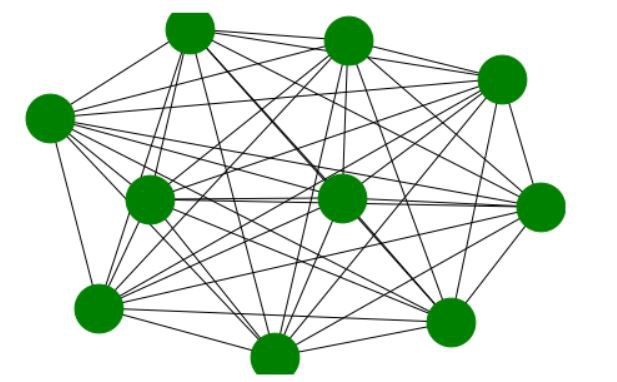
import networkx
G = networkx.complete_graph(10)
networkx.draw(G, node_color = 'green',
node_size = 1500)
|
Output:
Advantages and Disadvantages:
Advantages of using a complete graph in social network analysis include:
- Simplicity: Complete graphs are a simple structure that can be easily understood, making it easy to extract insights from the data.
- High connectivity: All nodes in a complete graph are connected to each other, which makes it easy to model all possible interactions between the nodes.
- Representing fully connected groups: Complete graphs can be used to represent groups where all members are fully connected, such as small teams or communities.
Disadvantages of using a complete graph in social network analysis include:
Limited representation of real-world networks: Complete graphs are a highly simplified representation of real-world networks, which may not accurately reflect the complexity and diversity of the relationships in a network.
High computational cost: Complete graphs have a high number of edges, which can make it computationally expensive to analyze and visualize.
Limited scalability: Complete graphs are not suitable for very large networks as the number of edges increases exponentially with the number of nodes.
Reference:
“Python NetworkX: A Practical Overview” by Shai Vaingast is a good reference book for learning NetworkX and its application in social network analysis. The book covers the basics of NetworkX and its use in solving real-world problems such as community detection, centrality measures, and graph visualization. It also includes examples of creating and analyzing complete graphs using NetworkX.
Like Article
Suggest improvement
Share your thoughts in the comments
Please Login to comment...