Classification and Tabulation of Data
Last Updated :
06 Apr, 2023
For performing statistical analysis, various kinds of data are gathered by the investigator or analyst. The information gathered is usually in raw form which is difficult to analyze. To make the analysis meaningful and easy, the raw data is converted or classified into different categories based on their characteristics. This grouping of data into different categories or classes with similar or homogeneous characteristics is known as the Classification of Data. Each division or class of the gathered data is known as a Class. The different basis of classifications of statistical information are Geographical, Chronological, Qualitative (Simple and Manifold), and Quantitative or Numerical.
For example, if an investigator wants to determine the poverty level of a state, he/she can do so by gathering the information of people of that state and then classifying them on the basis of their income, education, etc.
According to Conner, “Classification is the process of arranging things (either actually or notionally) in groups or classes according to their resemblances and affinities, and gives expression to the unity of attributes that may exist amongst a diversity of individuals.“
Now, to analyze the collected data, it is essential to present it in a way that is easy to understand and interpret. The different ways in which the classified data can be presented are textual, tabular, diagrammatic, and graphical presentation. Tabular Presentation or Tabulation is a systematic way of presenting the numerical data in rows and columns. The tabular presentation helps the investigator in simplifying the presentation and facilitating analysis. It can bring the related information close to each other such that the investigator can easily make comparisons between them, and also helps in further statistical analysis and interpretation of the data.
According to L.R. Connor, “Tabulation involves the orderly and systematic presentation of numerical data in a form designed to elucidate the problem under consideration.“
Classification of Data v/s Tabulation/Tabular Presentation of Data
Generally, classification of data and tabular presentation of data are misunderstood as the same, i.e., a device to present and summarize data. However, in technical terms, both concepts are different from each other. The difference between the classification of data and tabular presentation of data is as follows:
- Tabulation succeeds classification of data. It means that tabular presentation of data can be done only when it is classified into different classes.
- Classification of data includes classifying the given set of data into different classes according to their similarities and differences. However, tabular presentation of data includes arranging the classified data into rows and columns with suitable heads and subheads.
- Classification is a method of statistical analysis. However, tabular presentation of data is a method of presenting data.
Classification of Data and Tabular Presentation
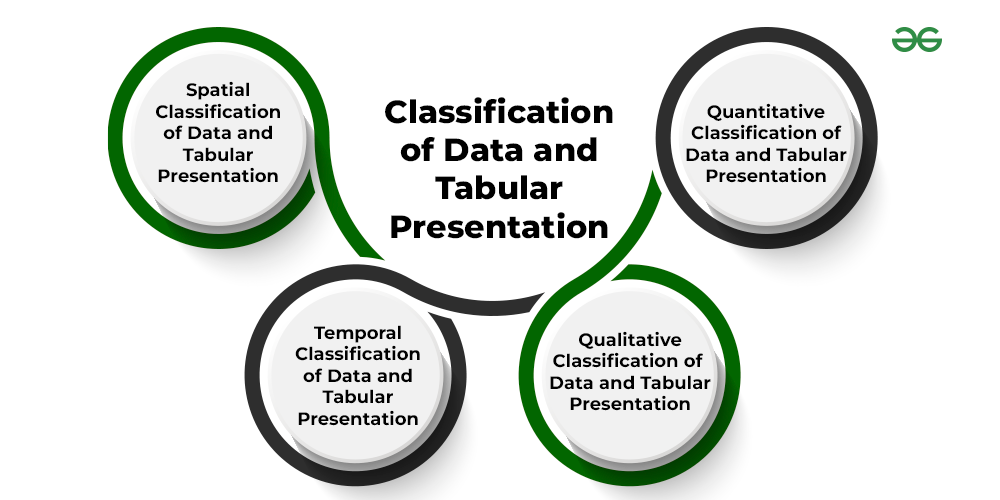
Classification of data is also used in tabular presentation and is of four types; viz., Geographical or Spatial Classification, Chronological or Temporal Classification, Qualitative Classification, and Quantitative Classification.
1. Spatial Classification of Data and Tabular Presentation
Spatial Classification of data means to classify data based on the geographical location, place, or region such as state, district, town, city, country, etc. For example, a number of students from different states at Delhi University. The Tabular presentation of the same can be shown as follows:
2. Temporal Classification of Data and Tabular Presentation
Temporal Classification of data means to classify data based on the time period. It means that time becomes the classifying variable in the case of temporal classification. For example, the sale of Laptops by a manufacturer in different years. The tabular presentation of the same can be shown as follows:
3. Qualitative Classification of Data and Tabular Presentation
Qualitative Classification of data means to classify data based on qualitative characteristics or attributes. For example, data of the students of Class XI can be classified on qualitative attributes like male or female, and Commerce or Science. The tabular presentation of the same can be shown as follows:
4. Quantitative Classification of Data and Tabular Presentation
Quantitative Classification of data means to classify data based on the quantitative characteristics. For example, data on the number of players playing different sports in a school. The tabular presentation of the same can be shown as follows:
Like Article
Suggest improvement
Share your thoughts in the comments
Please Login to comment...