Class 9 RD Sharma Solutions – Chapter 23 Graphical Representation of Statistical Data – Exercise 23.2 | Set 2
Last Updated :
18 Mar, 2021
Question 11. The following data gives the amount of manure (in a thousand tonnes) manufactured by a company during some years:
| Year |
1992 |
1993 |
1994 |
1995 |
1996 |
1997 |
|
Manure
(in thousand tonnes)
|
15 |
35 |
45 |
30 |
40 |
20 |
(i) Represent the above data with the help of a bar graph.
(ii) Indicate with the help of the bar graph the year in which the amount of manure manufactured by the company was maximum.
(in) Choose the correct alternative:
The consecutive years during which there was maximum decrease in manure production are:
(a) 1994 and 1995
(b) 1992 and 1993
(c) 1996 and 1997
(d) 1995 and 1996
Solution:
(i) The following bar graph represents information in the form of horizontal axes and vertical axes representing years and manure (in thousand tonnes) respectively.
(ii) The maximum amount of manure manufactured was 45 thousand tonnes produced in the year 1994.
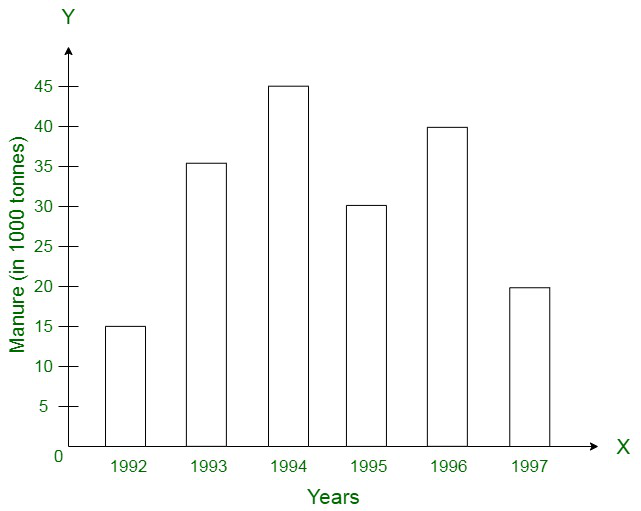
(iii) The maximum decrease in manure production was witnessed from the year 1996 to 1997.
Question 12. The following data gives the demand estimates of the Government of India, Department of Electronics for the personnel in the Computer sector during the Eighth Plan period (1990-95):
| Qualifications |
MCA
(Master in Computer Applications)
|
DCA
(Diploma in Computer Applications)
|
DCE
(Diploma in Computer Engineering)
|
CL
(Certificate Level Course)
|
ST
(Short-term course)
|
| Personnel Required |
40600 |
181600 |
18600 |
670600 |
1802900 |
Represent the data with the help of a bar graph. Indicate with the help of the bar graph the course where estimated requirement is least.
Solution:
The following bar graph represents information in the form of horizontal axes and vertical axes representing qualifications and personnel required respectively. The course where requirement expected least is DCE.
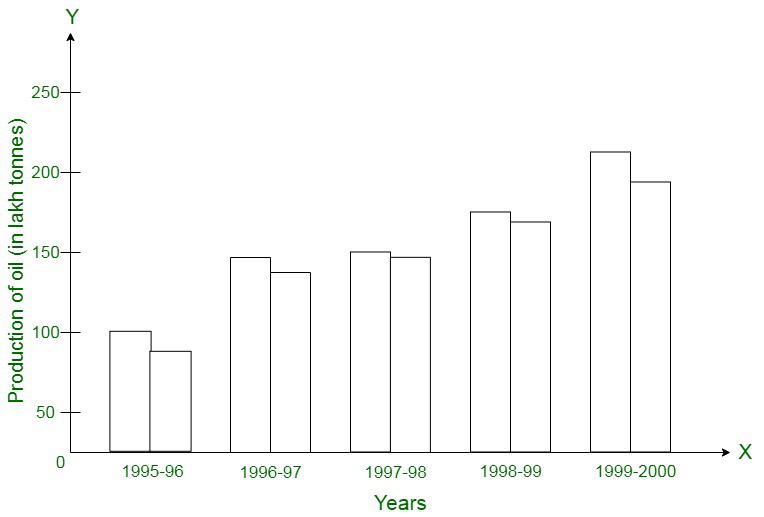
Question 13. The income and expenditure for 5 years of a family is given in the following data:
| Years |
1995-96 |
1996-97 |
1997-98 |
1998-99 |
1999-2000 |
| Income (rs in thousands) |
100 |
140 |
150 |
170 |
210 |
| Expenditure (rs in thousands) |
80 |
130 |
145 |
160 |
190 |
Represent the above data by a bar graph.
Solution:
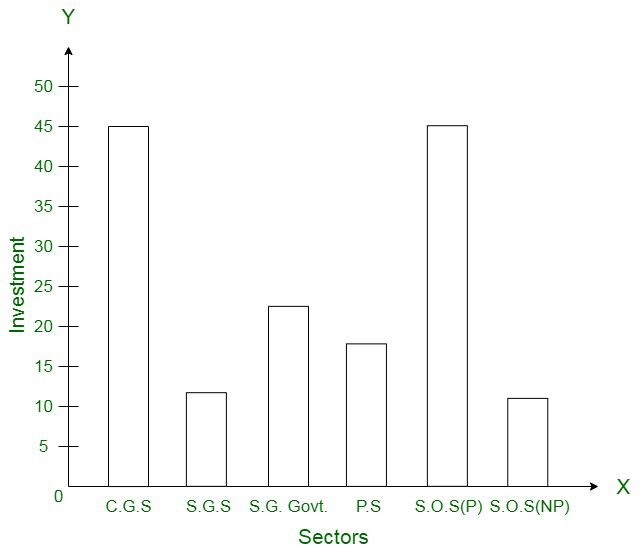
Question 14. The investment (in ten crores of rupees) of Life Insurance Corporation of India in different sectors are given below:
| Sectors |
Investment
(in ten crores of rupees)
|
| Central Government Securities |
45 |
| State Government Securities |
11 |
| Securities guaranteed by the govt. |
23 |
| Private Sectors |
18 |
| Socially oriented sectors (Plan) |
46 |
| Socially oriented sectors (Non-plan) |
11 |
Represent the above data with the help of a bar graph.
Solution:
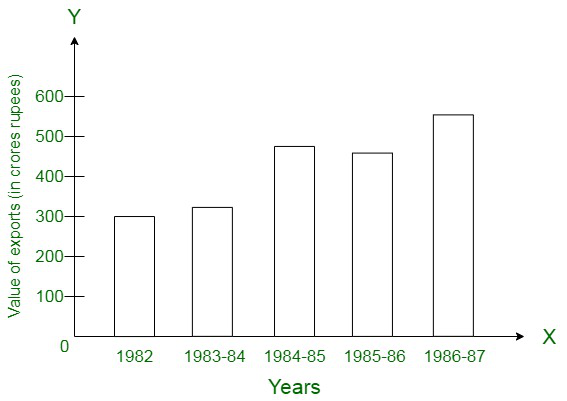
Question 15. The following data gives the value (in crores of rupees) of the Indian export of cotton textiles for different years:
| Years |
1982 |
1983-84 |
1984-85 |
1985-86 |
1986-87 |
|
Value of exports of cotton textiles
(in crore of rupees)
|
300 |
325 |
475 |
450 |
550 |
Represent the above data with the help of a bar graph. Indicate with the help of a bar graph the year in which the rate of increase in exports is maximum over the preceding year.
Solution:
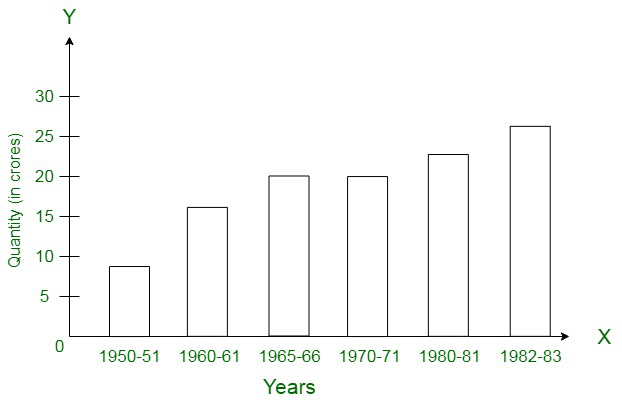
Question 16. The following table gives the quantity of good (in crore tonnes)
| Year |
1950-51 |
1960-61 |
1965-66 |
1970-71 |
1980-81 |
1982-83 |
|
Quantity of Goods
(in crore tonnes)
|
9 |
16 |
20 |
20 |
22 |
26 |
Represent this information with the help of a bar graph.
Explain through the bar graph if the quantity of goods carried by the Indian Railways in 1965-66 is more than double the quantity of goods carried in the year 1950-51.
Solution:
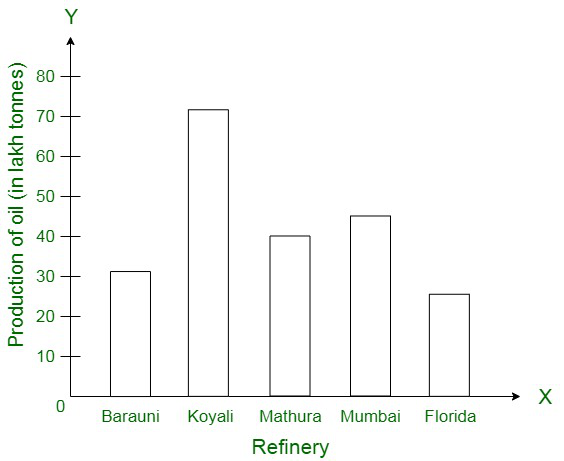
Question 17. The production of oil (in lakh tonnes) in some refineries in India during 1982 was given below:
| Refinery |
Barauni |
Koyali |
Mathura |
Mumbai |
Florida |
|
Production in oil
(in lakh tonnes)
|
30 |
70 |
40 |
45 |
25 |
Construct a bar graph to represent the above data so that the bars are drawn horizontally.
Solution:
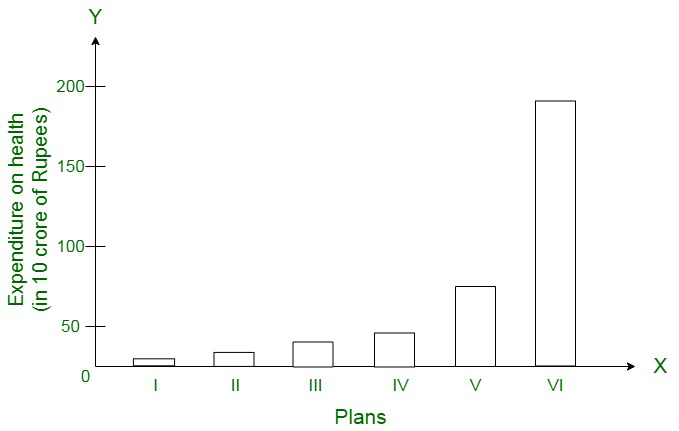
Question 18. The expenditure (in 10 crores of rupees) on health by the Government of India during the various five year plans is shown below:
| Plans |
I |
II |
III |
IV |
V |
VI |
|
Expenditure on health
(in 10 crores of rupees)
|
7 |
14 |
23 |
34 |
76 |
182 |
Construct a bar graph to represent the above data.
Solution:
Like Article
Suggest improvement
Share your thoughts in the comments
Please Login to comment...