Class 9 RD Sharma Solutions – Chapter 23 Graphical Representation of Statistical Data – Exercise 23.1 | Set 2
Last Updated :
09 Sep, 2022
Question 11. Read the following bar graph and answer the following questions:
(i) What information is given by the bar graph?
(ii) What was the production of cement in the year 1980-81?
(iii) What is the minimum and maximum productions of cement and corresponding years?
Solution:
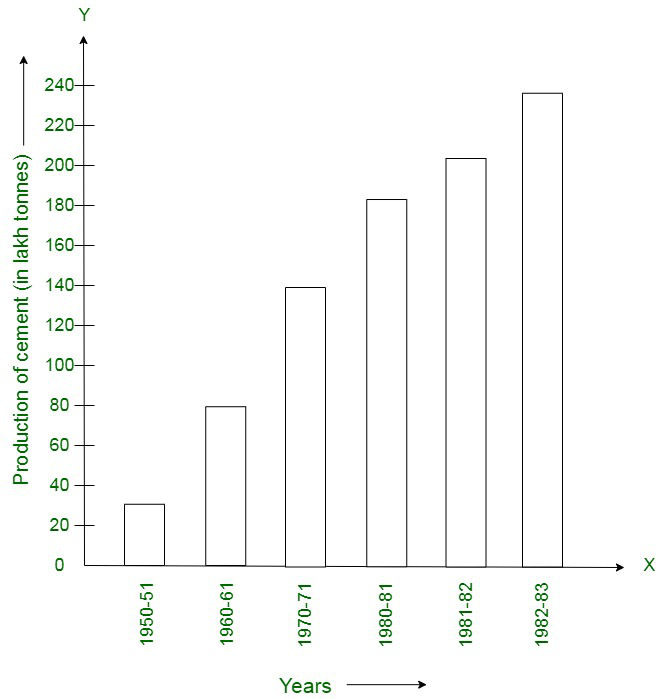
(i) The bar graph depicts the industrial production of cement in different years in India.
(ii) The production of cement in the year 1980-81 was 186 lakh tonnes.
(iii) Minimum production of cement was 30 lakh tonnes in 1950-51 and maximum production was 232 lakh tonnes in 1982-83 respectively.
Question 12. The bar graph shown in the figure represents the circulation of newspapers in 10 languages. Study the bar graph and answer the following questions:
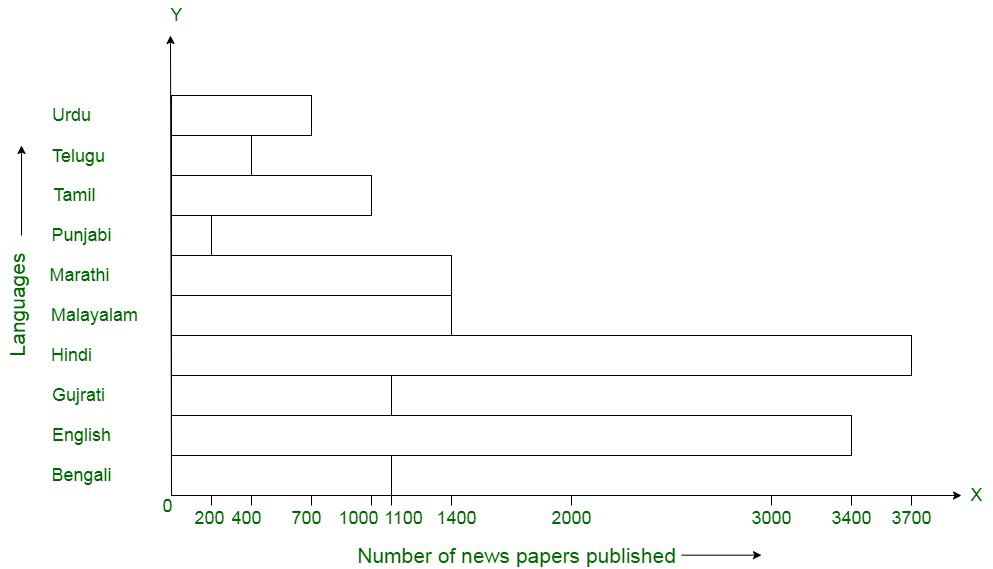
(i) What is the total number of newspapers published in Hindi, English, Urdu, Punjabi and Bengali?
(ii) What percent is the number of newspapers published in Hindi of the total number of newspapers?
(iii) Find the excess of the number of newspapers published in English over those published in Urdu,
(iv) Name two pairs of languages which publish the same number of newspapers.
(v) State the languages in which the smallest number of newspapers are published.
(vi) State the language in which the largest number of newspapers are published.
(vii) State the language in which the number of newspapers published is between 2500 and 3500.
(viii)State whether true or false:
(a) The number of newspapers published in Malayalam and Marathi together is- less than those published in English.
(b) The number of newspapers published in Telugu is more than those published in Tamil.
Solution:
(i) The total number of newspapers published in Hindi, English, Urdu, Punjabi, and Bengali are
= 3700 + 3400 + 700 + 200 + 1100 = 9100
(ii) The percent is the number of newspapers published in Hindi of the total number of newspapers
= (3700 * 100)/14400 = 25.69%
(iii) The excess of the number of newspapers published in English over those published in Urdu = Difference in English and Urdu = 3400 – 700 = 2700
(iv) Two pairs of languages which publish the same number of newspapers are Malayalam and Marathi, Bengali and Gujarati
(v) The language in which the smallest number of newspapers are published is Punjabi (200)
(vi) The language in which the largest number of newspapers are published is Hindi (3700)
(vii) The language in which the number of newspapers published is between 2500 and 3500 is English (3400)
(viii) (a) True (b) False
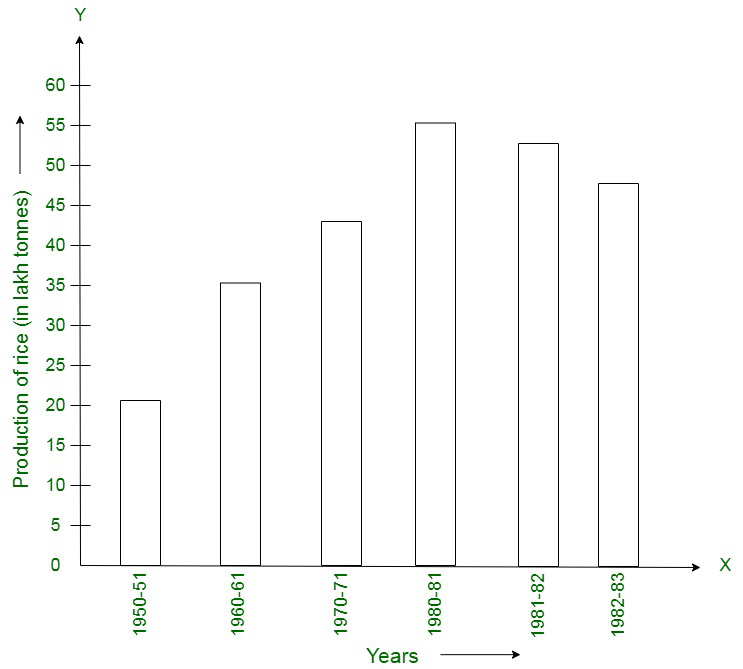
Question 13. Read the bar graph given in figure and answer the following questions:
(i) What information is given by the bar graph?
(ii) What was the crop-production if rice in 1970-71?
(iii) What is the difference between the maximum and minimum production of rice?
Solution:
(i) The bar graph illustrates the production of rice in India during different years.
(ii) Crop production of rice in 1970-71 was 42.5 lakh tonnes.
(iii) Differences in maximum and minimum production of rice is equivalent to 55 – 22 lakh tonnes = 33 lakh tonnes
Question 14. Read the bar graph given in figure and answer the following questions:
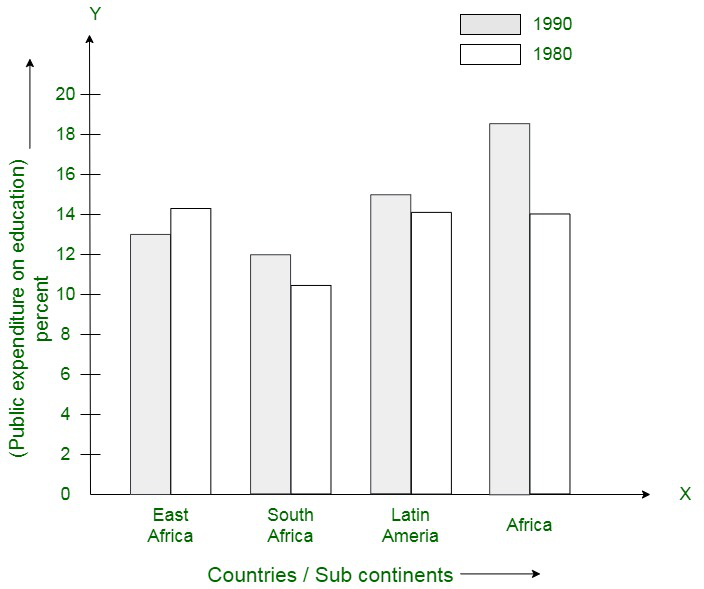
(i) What information does it give?
(ii) in which part the expenditure on education is maximum in 1980?
(iii) In which part the expenditure has gone up from 1980 to 1990?
(iv) In which part the gap between 1980 and 1990 is maximum?
Solution:
(i) The bar graph illustrates the public expenditure spent on education by vertices sub-continents in 1980 and 1990.
(ii) The expenditure on education is maximum in 1980 in Africa.
(iii) The expenditure from 1980 to 1990 was gone up in the continent of East Africa.
(iv) Maximum gap between 1980 and 1990 was witnessed in the continent of Africa.
Question 15. Read the bar graph given in the figure and answer the following questions:
(i) What information is given by the bar graph?
(ii) In which years the areas under the sugarcane crop were the maximum and the minimum?
(iii) State whether true or false:
The area under the sugarcane crop in the year 1982-83 is three times that of the year 1950-51.
Solution:
(i) The bar graph gives us information about the areas under sugarcane crop during different years in India.
(ii) Maximum sugarcane crop was witnessed in the years 1982-83 and minimum in 1950-51 respectively.
(iii) The given statement is false, because the area under the sugarcane crop in the year 1982-83 is nearly 2.5 times that of the year 1950-51.
Question 16. Read the bar graph given in the figure and answer the following questions:
(i) What information is given by the bar graph?
(ii) What was the expenditure on health and family planning in the year 1982-83?
(iii) In which year is the increase in expenditure maximum over the expenditure in previous year? What is the maximum increase?
Solution:
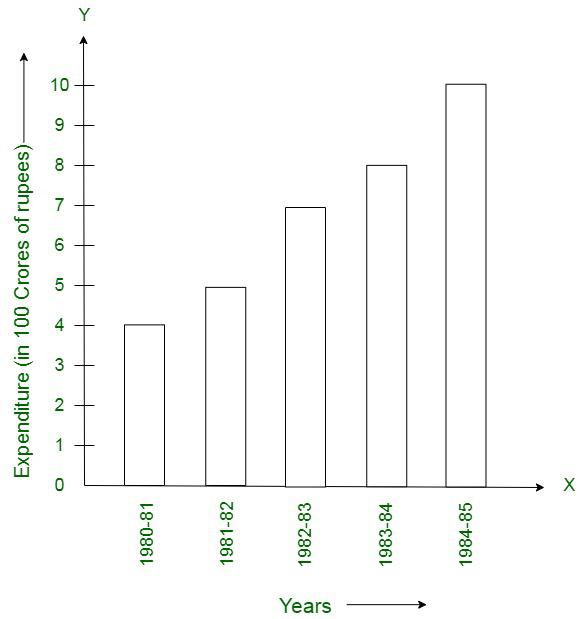
(i) The bar graph shows the expenditure on health and family planning during sixth five-year plan in India.
(ii) The expenditure on health and family planning in the year 1982-83 was 700 crore rupees.
(iii) Maximum increase was noticed in the year 1984-85 with a difference 10.2 – 8 = 220 crores during the successive years.
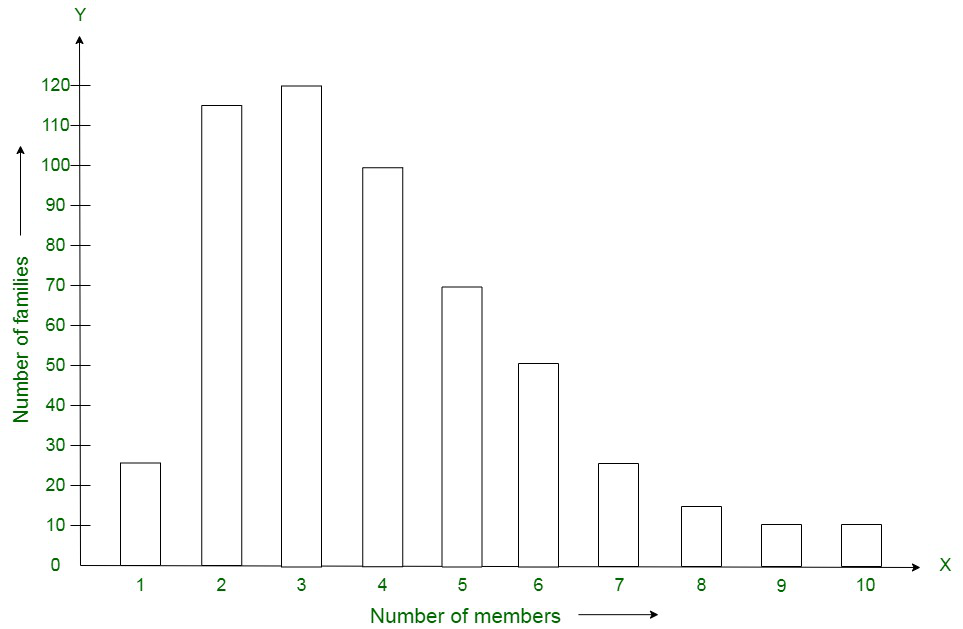
Question 17. Read the bar graph given in the figure and answer the following questions:
(i) What is the information given by the bar graph?
(ii) What is the number of families having 6 members?
(iii) How many members per family are there in the maximum number of families? Also tell the number of such families.
(iv) What are the number of members per family for which the number of families are equal? Also, tell the number of such families?
Solution:
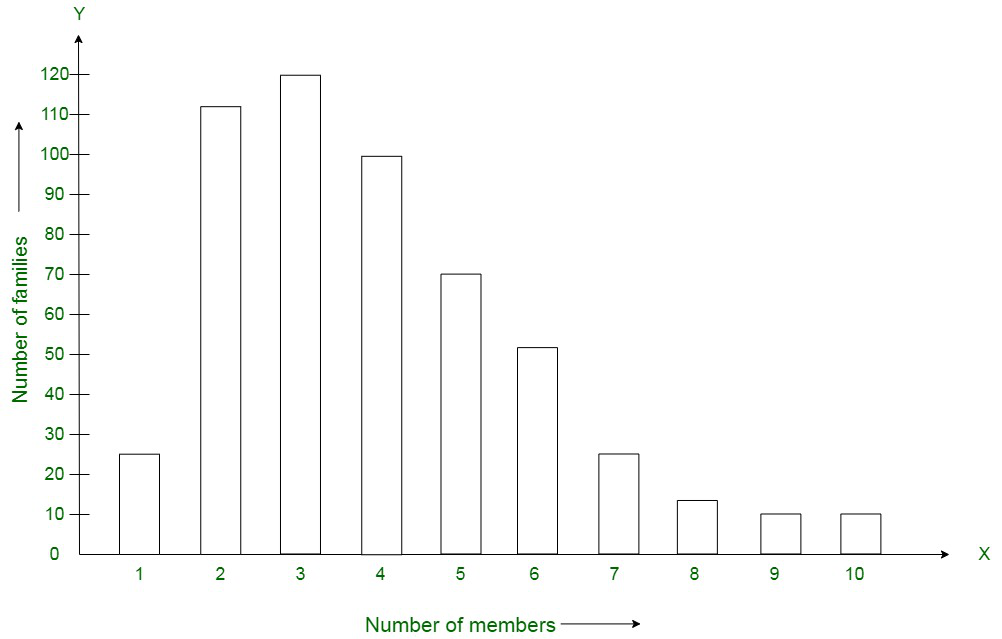
(i) The bar graph shows the number of families with different number of members in a locality.
(ii) Number of families having 6 members is equivalent to 50.
(iii) There are a maximum of 150 families with 3 members each.
(iv) There are 5 families each with 9 members and 10 members respectively.
Question 18. Read the bar graph given in the figure and answer the following questions:
(i) What information is given by the bar graph?
(ii) Which Doordarshan Centre covers maximum area? Also tell the covered area.
(iii) What is the difference between the areas covered by the Centre at Delhi and Bombay?
(iv) Which Doordarshan Centre are in U.P. State? What are the areas covered by them?
Solution:
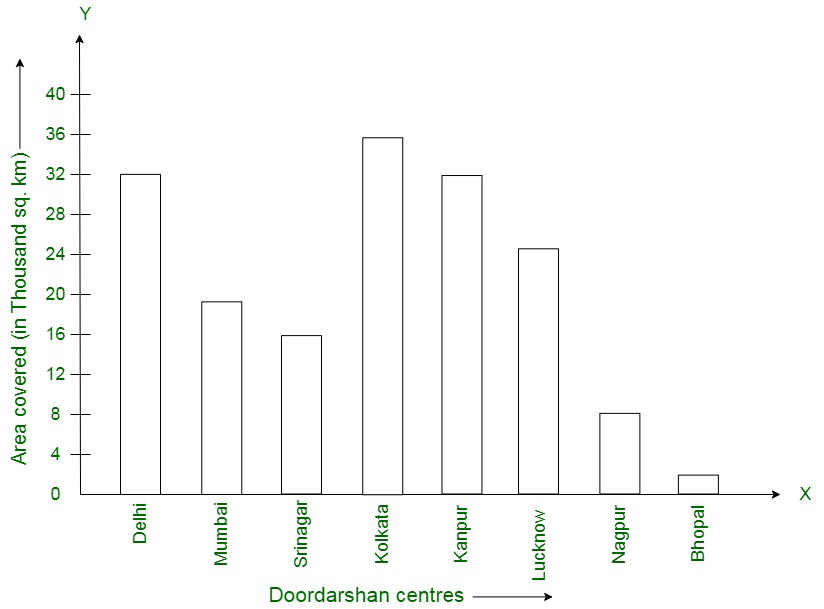
(i) The bar graph illustrates the coverage of certain Doordarshan centres in India.
(ii) The maximum area is of the Doordarshan kendra Kolkata which is equivalent to 36000 sq. km.
(iii) The difference between the areas covered by the Centre at Delhi and Bombay is equivalent to 32000 – 18000 = 14000 sq. km.
(iv) Doordarshan Centre in U.P. State are Kanpur (32000 sq. km) and Lucknow (25000 sq. km).
Like Article
Suggest improvement
Share your thoughts in the comments
Please Login to comment...