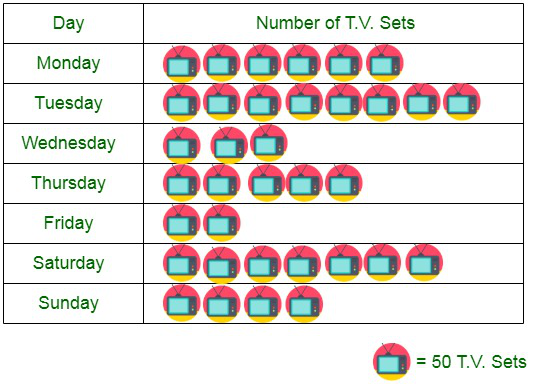
Question 1. The following table shows the daily production of T.V. sets in an industry for 7 days of a week.
| Day |
Monday |
Tuesday |
Wednesday |
Thursday |
Friday |
Saturday |
Sunday |
| Number of tv sets |
300 |
400 |
150 |
250 |
100 |
350 |
200 |
Represent the above information by a pictograph.
Solution:
The pictograph of the above information can be represented as follows :
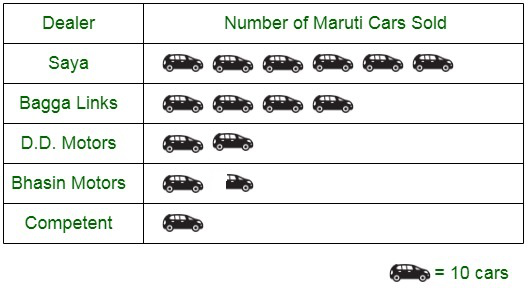
Question 2. The following table shows the number of Maruti cars sold by five dealers in a particular month:
| Dealer |
saya |
Bagaa links |
DD motors |
Bhasin Motors |
competent |
| cars sold |
60 |
40 |
20 |
15 |
10 |
Represent the above information by a pictograph.
Solution:
The pictograph of the above information can be represented as follows :
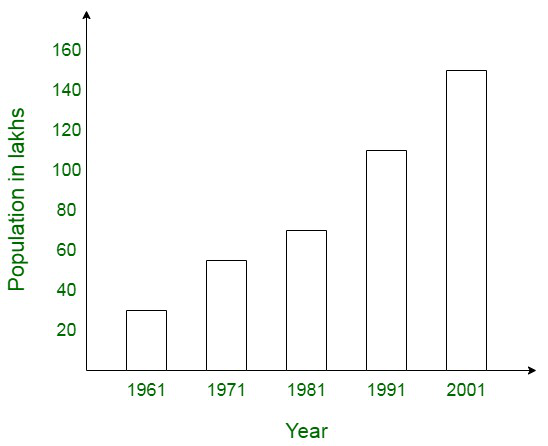
Question 3. The population of Delhi State in different census years is as given below:
| Census year |
1961 |
1971 |
1981 |
1991 |
2001 |
| Population in lakhs |
30 |
55 |
70 |
110 |
150 |
Represent the above information with the help of a bar graph.
Solutions:
The bar graph of the above information can be represented as follows :
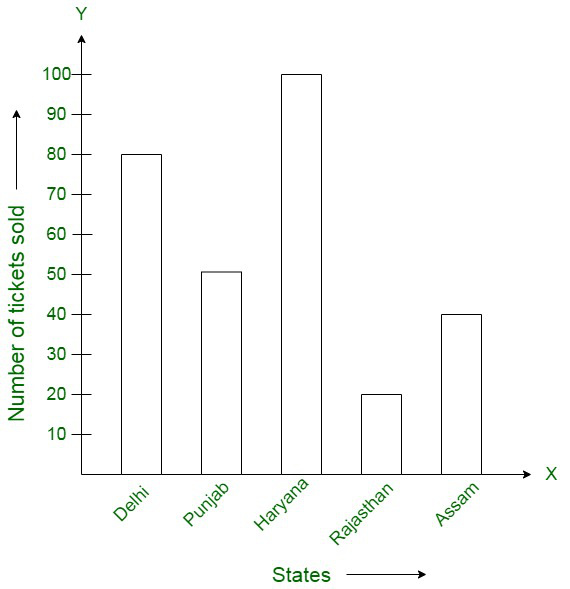
Question 4. Read the bar graph shown below and answer the following questions:
(i) What is the information given by the bar graph?
(ii) How many tickets of Assam State Lottery were sold by the agent?
(iii) Of which state, were the maximum number of tickets sold?
(iv) State whether true or false.
The maximum number of tickets sold is three times the minimum number of tickets sold.
(v) Of which state were the minimum numbers of tickets sold?
Solution:
(i) The bar graph represents the information of the number of tickets of different state lotteries sold by an agent on a day.
(ii) Number of tickets of Assam State Lottery were sold by the agent is equal to 40.
(iii) The state of Haryana sold the maximum numbers of tickets, equivalent to 100.
(iv) The state of Haryana sold the maximum numbers of tickets, equivalent to 100. The state of Rajasthan sold the maximum numbers of tickets, equivalent to 20. The maximum number of tickets sold is five times the minimum number of tickets sold.
Therefore, the statement is false.
(v) The state of Rajasthan sold the maximum numbers of tickets, equivalent to 20.
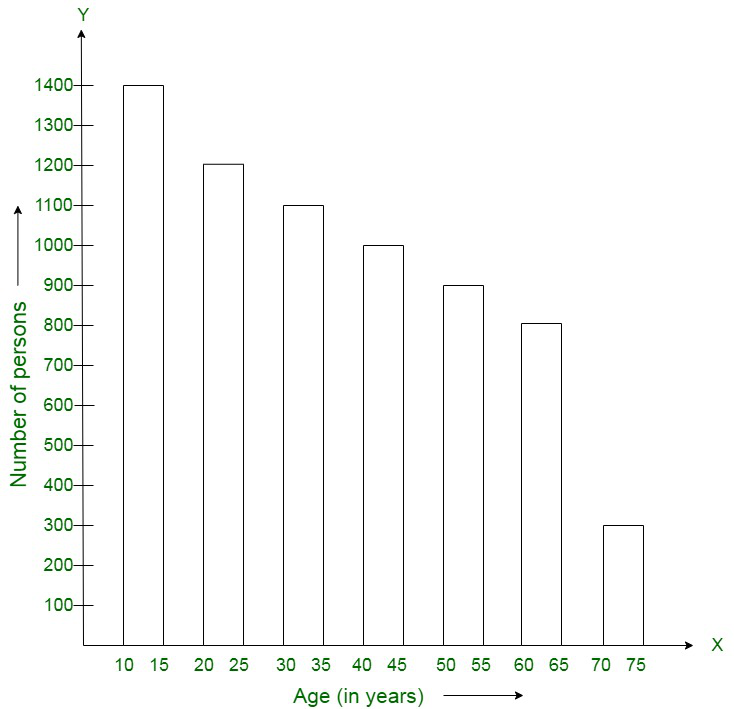
Question 5. Study the bar graph representing the number of persons in various age groups in a town shown in figure. Observe the bar graph and answer the following questions:
(i) What is the percentage of the youngest age-group persons over those in the oldest age group?
(ii) What is the total population of the town?
(iii) What is the number of persons in the age-group 60-65?
(iv) How many persons are more in the age-group 10-15 than in the age group 30-35?
(v) What is the age-group of exactly 1200 persons living in the town?
(vi) What is the total number of persons living in the town in the age-group 50-55?
(vii) What is the total number of persons living in the town in the age-groups 10-15 and 60-65?
(vii) Whether the population in general increases, decreases or remains constant with the increase in the age-group.
Solution:
(i) According to the bar graph, youngest age-group is 10-15 years and the number of persons belonging to this group is equal to 1400.
The oldest age-group, however, is 70-75 years and the number of persons belonging to this group = 300
Calculating, we get,
The percentage of youngest age-group persons compared to those in the oldest group is as below:
1400/300 × 100 = 1400/3
(ii) Total population of the town = 300 + 800 + 900 + 1000 + 1100 + 1200 + 1400 = 6700
(iii) Number of persons belonging in the age group 60 – 65 = 800.
(iv) Number of persons belonging in the age group 10 – 15 = 1400
Number of persons in the age group 30-35 = 1100.
Hence the number of more persons in the age group 10 – 15 than the group 30-35 is 1400 — 1100 = 300.
(v) Age group of the 1200 people living in the town is equal to 20 – 25.
(vi) Total number of persons living in the town in the age-group 50 – 55 is equivalent to 900.
(vii) Total number of persons living in the town in the age-groups 10 -15 and 60 – 65 is equivalent to 1400 + 800 = 2200.
(viii) Since, we can see that the height of the bars decreases as the age-group increases. Therefore, the population decreases with the increases in the age-group, as per the bar graph.
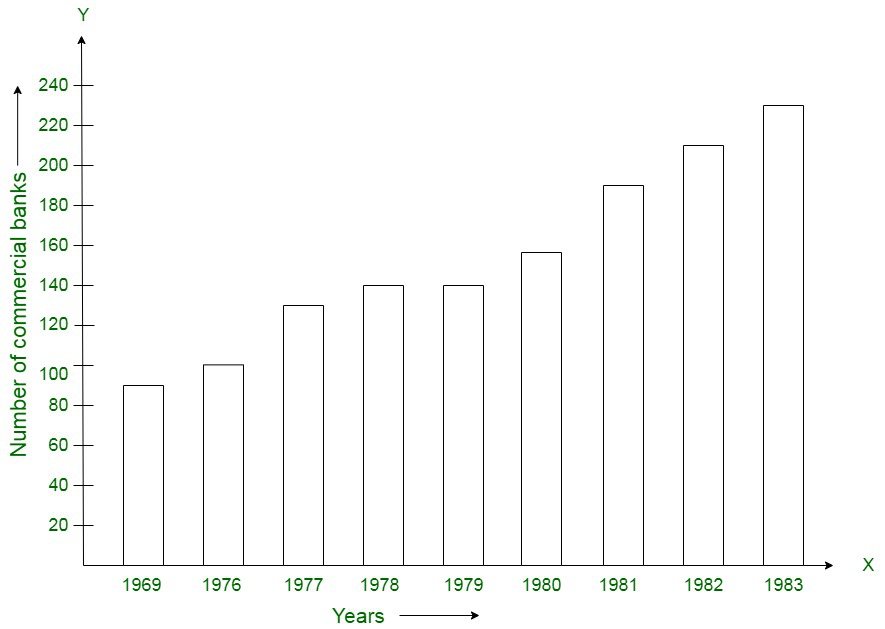
Question 6. Read the bar graph shown in figure and answer the following questions:
(i) What is the information given by the bar graph?
(ii) What was the number of commercial banks in 1977?
(iii) What is the ratio of the number of commercial banks in 1969 to that in 1980?
(iv) State whether true or false:
The number of commercial banks in 1983 is less than double the number of commercial banks in 1969.
Solution:
(i) The information depicted by the bar graph is a number of commercial banks in India during same years.
(ii) In 1977, the number of commercial banks were 130.
(iii) Ratio of banks in 1969 to 1980 is equivalent to 90 : 150 = 3:5
(iv) Number of banks in 1983 = 230 and the number of banks in 1969 = 90
∴ Number of banks in 1983 is less than double the number of banks in 1969. Therefore, this statement is false.
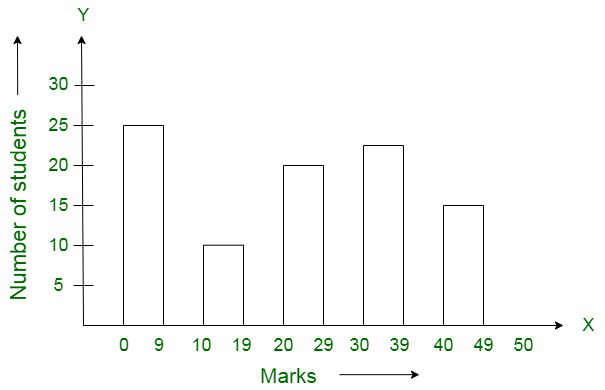
Question 7. Given below is the bar graph indicating the marks obtained out of 50 in mathematics paper by 100 students. Read the bar graph and answer the following questions:
(i) It is decided to distribute work books on mathematics to the students obtaining less than 20 marks, giving one workbook to each of such students. If a work book costs T5, what sum is required to buy the work books?
(ii) Every student belonging to the highest mark group is entitled to get a prize of ? 10. How much amount of money is required for distributing the prize money?
(iii) Every student belonging to the lowest mark-group has to solve 5 problems per day. How many problems, in all, will be solved by the students of this group per day?
(iv) State whether true or false. .
(a) 17% students have obtained marks ranging from 40 to 49.
(b) 59 students have obtained marks ranging from 10 to 29.
(v) What is the number of students getting less than 20 marks?
(vi) What is the number of students getting more than 29 marks?
(vii) What is the number of students getting marks between 9 and 40?
(viii)What is the number of students belonging to the highest mark group?
(ix) What is the number of students obtaining more than 19 marks?
Solution:
(i) Students getting less than 20 marks = 27 + 12 = 39
Cost of 1 work book = ₹5
Therefore, Total cost of 39 books = 39 × 5 = ₹195
(ii) No. of students getting the highest mark group is equivalent to 17
∴ Amount paid at the rate of Rs. 10 to each = 10 x 17 = Rs. 170
(iii) The Lowest mark group = 27
∴ Total number of problems given is equivalent to 27 x 5 = 135
(iv) (a) The statement is true
(b) The statement is false
(v) No. of students getting less than 20 marks is equivalent to 27 + 12 = 39
(vi) No. of students getting more than 29 marks is equivalent to 24 + 17 = 41
(vii) No. of students getting marks between 9 and 40 is equivalent to 12 + 20 + 24 = 56
(viii) No. of students to the highest mark group is equivalent to 17
(ix) No. of students setting more than 19 marks is equivalent to 20 + 24 + 17 = 61
Question 8. Read the following bar graph and answer the following questions:
(i) What is the information given by the bar graph?
(ii) State each of the following whether true or false.
(a) The number of government companies in 1957 is that of 1982 is 1 : 9.
(b) The number of government companies have decreased over the year 1957 to 1983.
Solution:
(i) The information depicts the number of government companies in India during some years.
(ii) (a) The number of government companies in 1957 is that of 1982 is 1 : 8. Therefore, the statement is false
(b) The number of government companies have increased over the year 1957 to 1983. Therefore, The statement is false
Question 9. Read the following bar graph and answer the following questions:
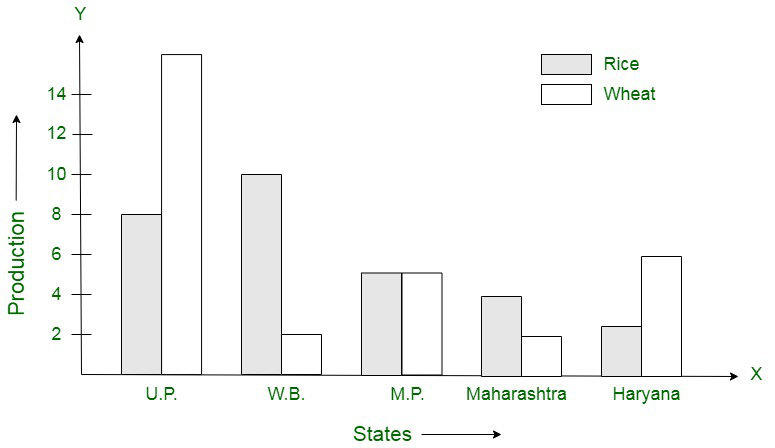
(i) What information is given by the bar graph?
(ii) Which state is the largest producer of rice?
(iii) Which state is the largest producer of wheat?
(iv) Which state has total production of rice and wheat as its maximum?
(v) Which state has the total production of wheat and rice minimum?
Solution:
(i) The bar graph shows the production of rice and wheat in different states of India.
(ii) West Bengal is the largest producer of rice.
(iii) U.P is the largest producer of wheat.
(iv) U.P has the maximum production of wheat and rice.
(v) Maharashtra has the minimum production of wheat and rice.
Question 10. The following bar graph represents the heights (in cm) of 50 students of Class XI of a particular school. Study the graph and answer the following questions:
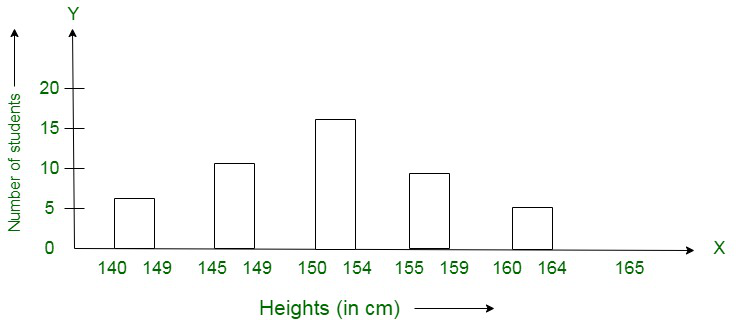
(i) What percentage of the total number of students have their heights more than 149 cm?
(ii) How many students in the class are in the range of maximum height of the class?
(iii) The school wants to provide a particular type of tonic to each student below the height of 150 cm to improve his height. If the cost of the tonic for each student comes out to be Rs. 55, how much amount of money is required?
(iv) How many students are in the range of shortest height of the class?
(v) State whether true or false:
(a) There are 9 students in the class whose heights are in the range of 155-159 cm.
(b) Maximum height (in cm) of a student in the class is 17.
(c) There are 29 students in the class whose heights are in the range of 145-154 cm.
(d) Minimum height (in cm) of a student is the class is in the range of 140-144 cms.
(e) The number of students in the class having their heights less than 150 cm is 12.
(f) There are 14 students each of whom has height more than 154 cm.
Solution:
(i) No. of students having more than height of 149 cm = 17 + 9 + 5 = 31
Therefore, percentage of students having more than height of 149 cm= 31/50 x 100 = 62%
(ii) Total no. of students in the range of maximum height is equivalent to 5
(iii) Total no. of students below the height of 150 cm is equivalent to 7 + 12 = 19
Cost of tonic for each student = ₹55
Therefore, Total cost of 19 = ₹55 x 19 = ₹1045
(iv) No. of students with the shortest height is equivalent to 7
(v) The following statements hold the following truth values :
(a) True
(b) False
(c) True
(d) True
(e) False
(f) True
Like Article
Suggest improvement
Share your thoughts in the comments
Please Login to comment...