Class 8 RD Sharma Solutions – Chapter 25 Data Handling III (Pictorial Representation Of Data As Pie Charts Or Circle Graphs) – Exercise 25.1 | Set 2
Last Updated :
19 Apr, 2021
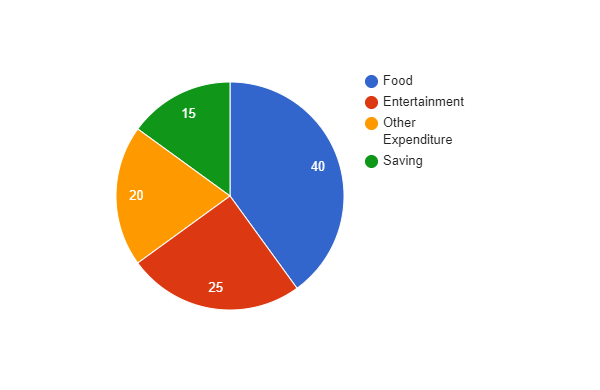
Question 11. The following table shows how a student spends his pocket money during the course of a month. Represent it by a pie diagram.
| Items |
Food |
Entertainment |
Other Expenditure |
Saving |
| Expenditure (in %) |
40 |
25 |
20 |
15 |
Solution:
Given that, total Expenditure = 100%
Therefore,
Central angle = (component value/100) × 360°
Now the central angle for each activity will be calculated as follows:
| Items |
Expenditure (in %) |
Central Angle |
| Food |
40 |
40/100 * 360 = 144 |
| Entertainments |
25 |
25/100 * 360 = 90 |
| Other Expenditure |
20 |
20/100 * 360 = 72 |
| Saving |
15 |
15/100 * 360 = 54 |
Steps to construct pie chart using above data :
Step 1. First draw the circle of an appropriate radius.
Step 2. Now draw a vertical radius anywhere inside the circle.
Step 3. Now choose the largest central angle. Construct a sector of central angle, whose one radius coincides with the radius drawn in step 2 and the other radius is in clockwise direction to the vertical radius.
Step 4. Construct other sectors representing other values in clockwise direction in descending order of values of their central angles.
Step 5. Shade the sectors so obtained by different colors and label them.
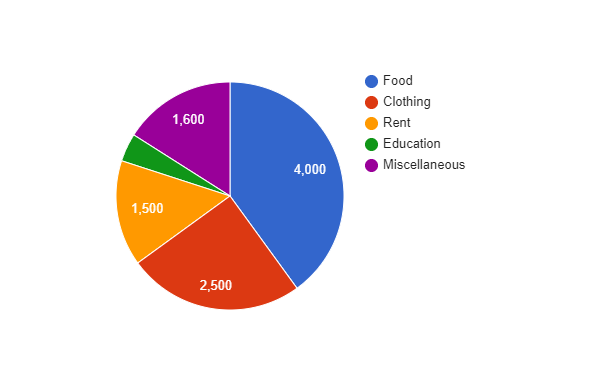
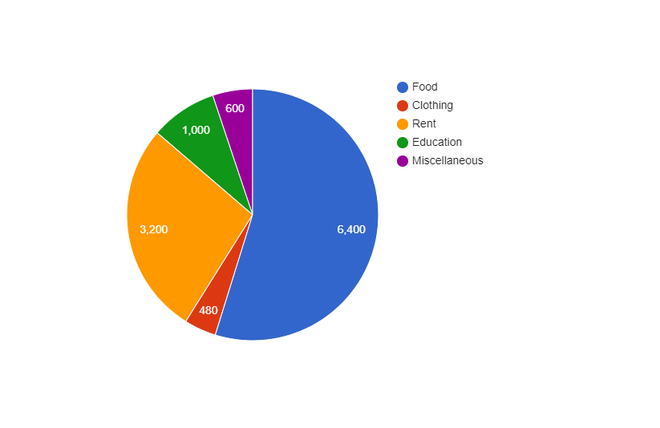
Question 12. Represent the following data by a pie diagram:
| Items of Expenditure |
Expenditure |
| |
Family A Family B |
| Food |
4000 6400 |
| Clothing |
2500 480 |
| Rent |
1500 3200 |
| Education |
400 1000 |
| Miscellaneous |
1600 600 |
| Total |
10000 16000 |
Solution:
Given that, the total expenditure of family A = 10000 and family B = 11680
Central angle for family A = (component value/10000) × 360°
Central angle for family B = (component value/11680) × 360°
Now the central angle for each activity will be calculated as follows :
| Items of Expenditure |
Expenditure Family A |
Expenditure Family B |
Central Angle of Family A |
Central Angle of Family B |
| Food |
4000 |
6400 |
4000/10000 * 360 = 144 |
6400/11680 * 360 = 197.6 |
| Clothing |
2500 |
480 |
2500/10000 * 360 = 90 |
480/11680 * 360 = 14.8 |
| Rent |
1500 |
3200 |
1500/10000 * 360 = 54 |
3200/11680 * 360 = 98.6 |
| Education |
400 |
1000 |
400/10000 * 360 = 14.4 |
1000/11680 * 360 = 30.8 |
| Miscellaneous |
1600 |
600 |
1600/10000 * 360 =57.6 |
600/11680 * 360 = 18.5 |
Steps to construct pie chart using above data :
Step 1. First draw the circle of an appropriate radius.
Step 2. Now draw a vertical radius anywhere inside the circle.
Step 3. Now choose the largest central angle then construct a sector of central angle, whose one radius coincides with the radius drawn in step 2 and the other radius is in clockwise direction to the vertical radius.
Step 4. Construct other sectors representing other values in clockwise direction in descending order of values of their central angles.
Step 5. Shade the sectors so obtained by different colors and label them.
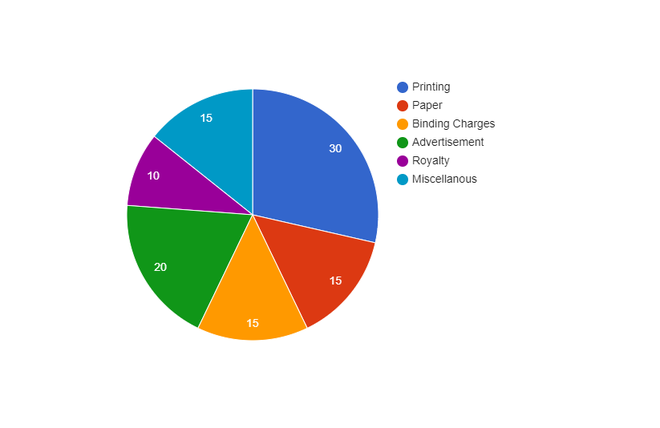
Question 13. Following data gives the break up of the cost of production of a book:
| Printing |
Paper |
Binding Charges |
Advertisement |
Royalty |
Miscellaneous |
| 30% |
15% |
15% |
20% |
10% |
15% |
Draw a pie-diagram depicting the above information.
Solution:
Given that, total cost of production of book = 105%
Therefore,
Central angle = (component value/105) × 360°
Now the central angle for each activity will be calculated as follows :
| Items |
Expenditure (in %) |
Central Angle |
| Printing |
30 |
30/105 * 360 = 102.9 |
| Paper |
15 |
15/105 * 360 = 51.4 |
| Binding Charges |
15 |
15/105 * 360 = 51.4 |
| Advertisement |
20 |
20/105 * 360 = 68.6 |
| Royalty |
10 |
10/105 * 360 = 34.3 |
| Miscellaneous |
15 |
15/105 * 360 = 51.4 |
Steps to construct pie chart using above data :
Step 1. First draw the circle of an appropriate radius.
Step 2. Now draw a vertical radius anywhere inside the circle.
Step 3. Now choose the largest central angle. Then construct a sector of central angle, whose one radius coincides with the radius drawn in step 2 and the other radius is in clockwise direction to the vertical radius.
Step 4. Construct other sectors representing other values in clockwise direction in descending order of values of their central angles.
Step 5. Shade the sectors so obtained by different colors and label them.
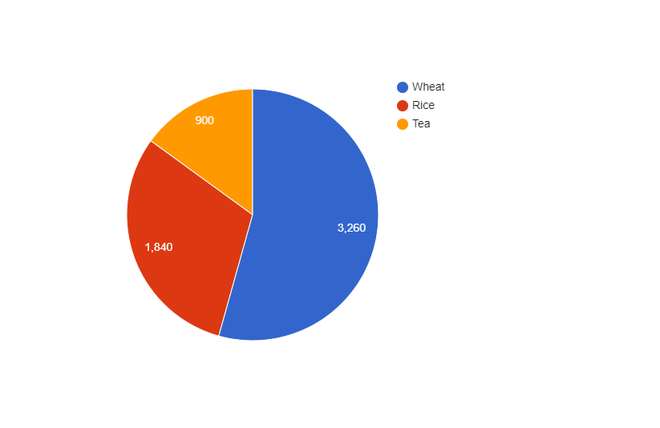
Question 14. Represent the following data with the help of pie diagram:
| Items |
Wheat |
Rice |
Tea |
| Production (in metric tons) |
3260 |
1840 |
900 |
Solution:
Given that, total cost of production = 6000 metric tons
Therefore,
Central angle = (component value/6000) × 360°
Now the central angle for each activity will be calculated as follows :
| Items |
Production |
Central Angle |
| Wheat |
3260 |
3260/6000 * 360 = 195.6 |
| Rice |
1840 |
1840/6000 * 360 = 110.4 |
| Tea |
900 |
900/6000 * 360 = 54 |
Steps to construct pie chart using above data :
Step 1. First draw the circle of an appropriate radius.
Step 2. Now draw a vertical radius anywhere inside the circle.
Step 3. Now choose the largest central angle then construct a sector of central angle, whose one radius coincides with the radius drawn in step 2 and the other radius is in clockwise direction to the vertical radius.
Step 4. Construct other sectors representing other values in clockwise direction in descending order of values of their central angles.
Step 5. Shade the sectors so obtained by different colors and label them.
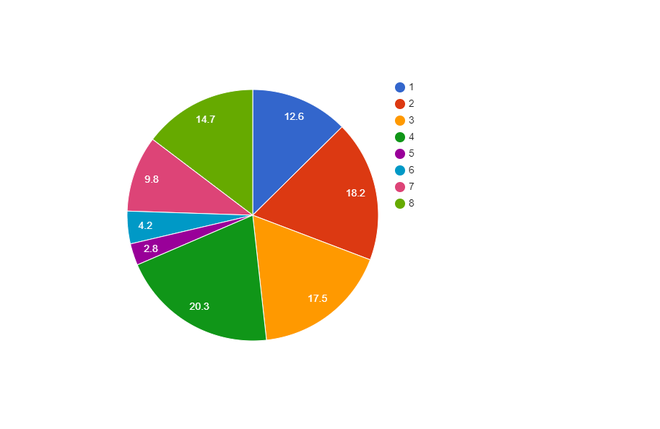
Question 15. Draw a pie-diagram representing the relative frequencies (expressed as percentage) of the eight classes as given below:
12.6, 18.2, 17.5, 20.3, 2.8, 4.2, 9.8, 14.7
Solution:
Given that, total amount = 100.1%
Therefore,
Central angle = (component value/100.1) × 360°
Now the central angle for each activity will be calculated as follows :
| Class |
Amount (in %) |
Central Angle |
| 1 |
12.6 |
12.6/100.1 * 360 = 45.3 |
| 2 |
18.2 |
18.2/100.1 * 360 = 65.5 |
| 3 |
17.5 |
17.5/100.1 * 360 = 62.9 |
| 4 |
20.3 |
20.3/100.1 * 360 = 73 |
| 5 |
2.8 |
2.8/100.1 * 360 = 10.1 |
| 6 |
4.2 |
4.2/100.1 * 360 = 15.1 |
| 7 |
9.8 |
9.8/100.1 * 360 = 35.2 |
| 8 |
14.7 |
14.7/100.1 * 360 = 52.9 |
Steps to construct pie chart using above data :
Step 1. First draw the circle of an appropriate radius.
Step 2. Now draw a vertical radius anywhere inside the circle.
Step 3. Now choose the largest central angle then construct a sector of central angle, whose one radius coincides with the radius drawn in step 2 and the other radius is in clockwise direction to the vertical radius.
Step 4. Construct other sectors representing other values in clockwise direction in descending order of values of their central angles.
Step 5. Shade the sectors so obtained by different colors and label them.
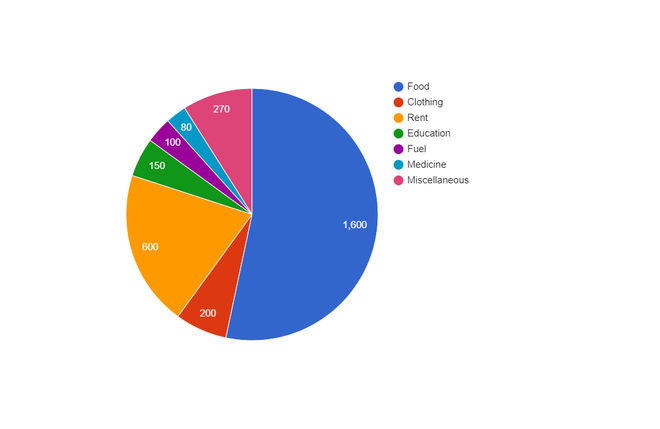
Question 16. Following is the break up of the expenditure of a family on different items of consumption:
| Items |
Food |
Clothing |
Rent |
Education |
Fuel etc |
Medicine |
Miscellaneous |
| Expenditure (in Rs) |
1600 |
200 |
600 |
150 |
100 |
80 |
270 |
Draw a pie-diagram to represent the above data.
Solution:
Given that, total expenditure = 3000 Rs
Therefore,
Central angle = (component value/3000) × 360°
Now the central angle for each activity will be calculated as follows :
| Items |
Expenditure (in Rs) |
Central Angle |
| Food |
1600 |
1600/3000 * 360 = 192 |
| Clothing |
200 |
200/3000 * 360 = 24 |
| Rent |
600 |
600/3000 * 360 = 72 |
| Education |
150 |
150/3000 * 360 = 18 |
| Fuel |
100 |
100/3000 * 360 = 12 |
| Medicine |
80 |
80/3000 * 360 = 9.6 |
| Miscellaneous |
270 |
270/3000 * 360 = 32.4 |
Steps to construct pie chart using above data :
Step 1. First draw the circle of an appropriate radius.
Step 2. Now draw a vertical radius anywhere inside the circle.
Step 3. Now choose the largest central angle then construct a sector of central angle, whose one radius coincides with the radius drawn in step 2 and the other radius is in clockwise direction to the vertical radius.
Step 4. Construct other sectors representing other values in clockwise direction in descending order of values of their central angles.
Step 5. Shade the sectors so obtained by different colors and label them.
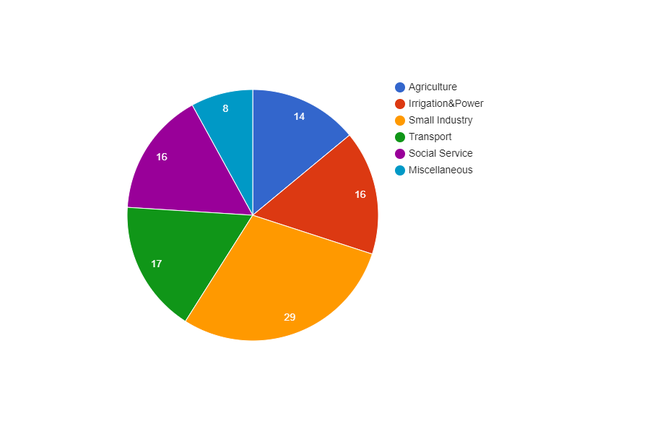
Question 17. Draw a pie diagram for the following data of the investment pattern in a five years plan:
| Agriculture |
Irrigation and Power |
Small Industries |
Transport |
Social Service |
Miscellaneous |
| 14% |
16% |
29% |
17% |
16% |
8% |
Solution:
Given that, total investment = 100%
Therefore,
Central angle = (component value/100) × 360°
Now the central angle for each activity will be calculated as follows :
| Data |
Investment (in %) |
Central Angle |
| Agriculture |
14 |
14/100 * 360 = 50.4 |
| Irrigation and Power |
16 |
16/100 * 360 = 57.6 |
| Small Industries |
29 |
29/100 * 360 = 104.4 |
| Transport |
17 |
17/100 * 360 = 61.2 |
| Social Services |
16 |
16/100 * 360 = 57.6 |
| Miscellaneous |
8 |
8/100 * 360 = 28.8 |
Steps to construct pie chart using above data :
Step 1. First draw the circle of an appropriate radius.
Step 2. Now draw a vertical radius anywhere inside the circle.
Step 3. Now choose the largest central angle then construct a sector of central angle, whose one radius coincides with the radius drawn in step 2 and the other radius is in clockwise direction to the vertical radius.
Step 4. Construct other sectors representing other values in clockwise direction in descending order of values of their central angles.
Step 5. Shade the sectors so obtained by different colors and label them.
Like Article
Suggest improvement
Share your thoughts in the comments
Please Login to comment...