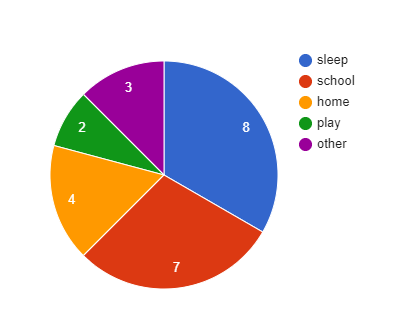
Question 1. The number of hours, spent by a school boy on different activities in a working day, is given below:
| Activity |
Sleep |
School |
Home |
Play |
Other |
Total |
| Number of Hours |
8 |
7 |
4 |
2 |
3 |
24 |
Present the information in the form of a pie-chart.
Solution:
Given that, total number of hours = 24
Therefore,
Central angle = (component value / 24) × 360°
Now the central angle for each activity will be calculated as follows :
| Activity |
Number of Hours |
Central Angle |
| Sleep |
8 |
8/24 x 360 = 120 |
| School |
7 |
7/24 x 360 = 105 |
| Home |
4 |
4/24 x 360 = 60 |
| Play |
2 |
2/24 x 360 = 30 |
| Others |
3 |
3/24 x 360 = 45 |
Steps to construct pie chart using above data:
Step 1. Draw the circle of an appropriate radius.
Step 2. Draw a vertical radius anywhere in the circle.
Step 3. Now choose the largest central angle here, it is 120o then Construct a sector of central angle 120o whose one radius coincides with the radius drawn in step 2 and the other radius is in clockwise direction to the vertical radius.
Step 4. Construct other sectors representing other values in clockwise direction in descending order of values of their central angles.
Step 5. Shade the sectors so obtained by different colors and label them.
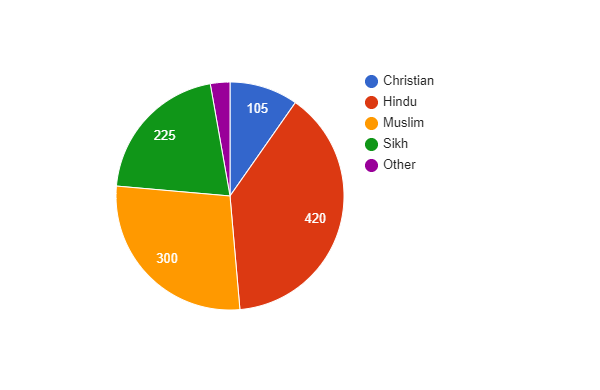
Question 2. Employees of a company have been categorized according to their religions as given below :
| Religious |
Hindu |
Muslim |
Sikh |
Christian |
Others |
Total |
| Number of Workers |
420 |
300 |
225 |
105 |
30 |
1080 |
Draw a pie-chart to represent the above information.
Solution:
Given that, total number of workers = 1080
Therefore,
Central angle = (component value / 1080) × 360°
Now the central angle for each activity will be calculated as follows :
| Religious |
Number of Workers |
Central Angle |
| Hindu |
420 |
420/1080 x 360 = 144 |
| Muslim |
300 |
300/1080 x 360 = 100 |
| Sikh |
225 |
225/1080 x 360 = 75 |
| Christian |
105 |
105/1080 x 360 = 35 |
| Others |
30 |
30/1080 x 360 = 10 |
Steps to construct pie chart using above data :
Step 1. Draw the circle of an appropriate radius.
Step 2. Now draw a vertical radius anywhere inside the circle.
Step 3. Now choose the largest central angle. Construct a sector of central angle, whose one radius coincides with the radius drawn in step 2 and the other radius is in clockwise direction to the vertical radius.
Step 4. Construct other sectors representing other values in clockwise direction in descending order of values of their central angles.
Step 5. Shade the sectors so obtained by different colors and label them.
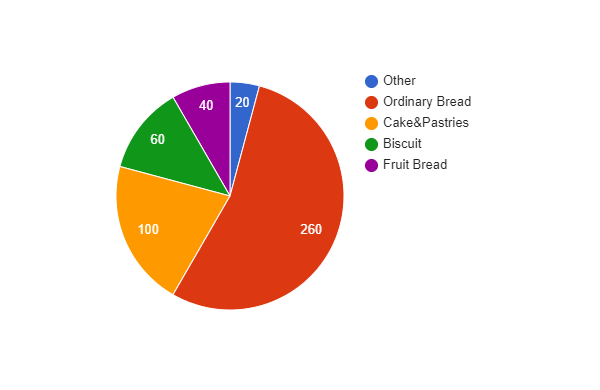
Question 3. In one day the sales (in rupees) of different items of a baker’s shop are given below:
| Items |
Ordinary Bread |
Fruit Bread |
Cake and Pastries |
Biscuit |
Others |
Total |
| Sales (in Rs.) |
260 |
40 |
100 |
60 |
20 |
480 |
Draw a pie-chart to represent the above information.
Solution:
Given that, total sales = 480
Therefore,
Central angle = (component value/480) × 360°
Now the central angle for each activity will be calculated as follows :
| Items |
Sales (in Rs) |
Central Angle |
| Ordinary Bread |
260 |
260/480 * 360 = 195 |
| Fruit Bread |
40 |
40/480 *360 = 30 |
| Cakes and Pastries |
100 |
100/480 * 360 = 75 |
| Biscuit |
60 |
60/480 * 360 = 45 |
| Others |
20 |
20/480 * 360 = 15 |
Steps to construct pie chart using above data :
Step 1. Draw the circle of an appropriate radius.
Step 2. Now draw a vertical radius anywhere inside the circle.
Step 3. Now choose the largest central angle. Construct a sector of central angle, whose one radius coincides with the radius drawn in step 2 and the other radius is in clockwise direction to the vertical radius drawn in step 2.
Step 4. Construct other sectors representing other values in clockwise direction in descending order of values of their central angles.
Step 5. Shade the sectors so obtained by different colors and label them.
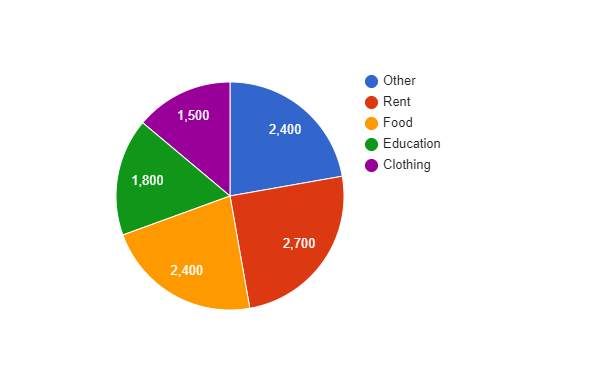
Question 4. The following data shows the expenditure of a person on different items during a month. Represent the data by a pie-chart.
| Items of Expenditure |
Rent |
Education |
Food |
Clothing |
Others |
| Amount (in Rs) |
2700 |
1800 |
2400 |
1500 |
2400 |
Solution:
Given that, total amount = 10800 Rs
Therefore,
Central angle = (component value/10800) × 360°
Now the central angle for each activity will be calculated as follows :
| Items of Expenditure |
Amount (in Rs) |
Central Angle |
| Rent |
2700 |
2700/10800 * 360 = 90 |
| Education |
1800 |
1800/10800 * 360 = 60 |
| Food |
2400 |
2400 / 10800 * 360 = 80 |
| Clothing |
1500 |
1500/10800 * 360 = 50 |
| Others |
2400 |
2400/10800 * 360 = 80 |
Steps to construct pie chart using above data :
Step 1. Draw the circle of an appropriate radius.
Step 2. Now draw a vertical radius anywhere inside the circle.
Step 3. Choose the largest central angle. Construct a sector of central angle, whose one radius coincides with the radius drawn in step 2 and the other radius is in clockwise direction to the vertical radius.
Step 4. Construct other sectors representing other values in clockwise direction in descending order of values of their central angles.
Step 5. Shade the sectors so obtained by different colors and label them.
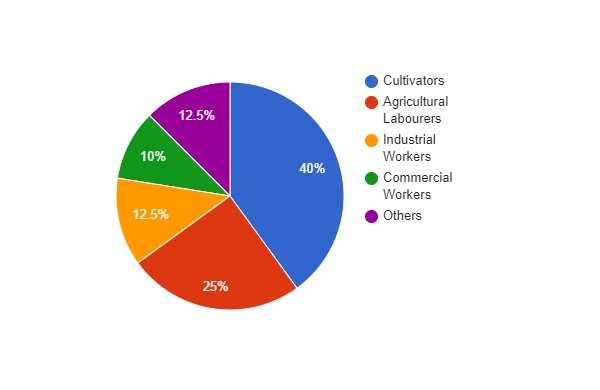
Question 5. The percentages of various categories of workers in a state are given in the following table.
| Category |
Cultivators |
Agriculture Labors |
Industrial Workers |
Commercial Workers |
Others |
| % of Workers |
40 |
25 |
12.5 |
10 |
12.5 |
Present the information in the form of a pie-chart.
Solution:
Given that, total % of workers = 100%
Therefore,
Central angle = (component value/100) × 360°
Now the central angle for each activity will be calculated as follows :
| Categories |
% of Workers |
Central Angle |
| Cultivators |
40 |
40/100 * 360 = 144 |
| Agriculture Labors |
25 |
25/100 * 360 = 90 |
| Industrial Workers |
12.5 |
12.5/100 * 360 = 45 |
| Commercial Workers |
10 |
10/100 * 360 = 36 |
| Others |
12.5 |
12.5/100 * 360 = 45 |
Steps to construct pie chart using above data :
Step 1. Draw the circle of an appropriate radius.
Step 2. Now draw a vertical radius anywhere inside the circle.
Step 3. Now choose the largest central angle. Construct a sector of central angle, whose one radius coincides with the radius drawn in step 2 and the other radius is in clockwise direction to the vertical radius.
Step 4. Construct other sectors representing other values in clockwise direction in descending order of values of their central angles.
Step 5. Shade the sectors so obtained by different colors and label them.
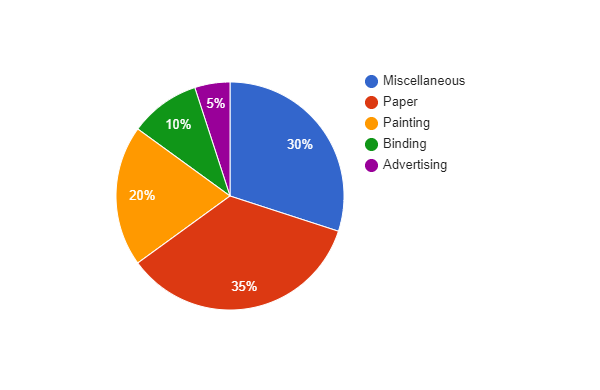
Question 6. The following table shows the expenditure incurred by a publisher in publishing a book :
| Items |
Papers |
Printing |
Binding |
Advertising |
Miscellaneous |
| Expenditure (in %) |
35% |
20% |
10% |
5% |
30% |
Present the above data in the form of pie-chart.
Solution:
Given that, total Expenditure (in %) = 100%
Therefore,
Central angle = (component value/100) × 360°
Now the central angle for each activity will be calculated as follows :
| Items |
Expenditure (in %) |
Central Angle |
| Papers |
35% |
35/100 * 360 = 126 |
| Printing |
20% |
20/100 * 360 = 72 |
| Binding |
10% |
10/100 * 360 = 36 |
| Advertising |
5% |
5/100 * 360 = 18 |
| Miscellaneous |
30% |
30/100 * 360 = 108 |
Steps to construct pie chart using above data :
Step 1. Draw the circle of an appropriate radius.
Step 2. Now draw a vertical radius anywhere inside the circle.
Step 3. Now choose the largest central angle. Construct a sector of central angle, whose one radius coincides with the radius drawn in step 2 and the other radius is in clockwise direction to the vertical radius.
Step 4. Construct other sectors representing other values in clockwise direction in descending order of values of their central angles.
Step 5. Shade the sectors so obtained by different colors and label them.
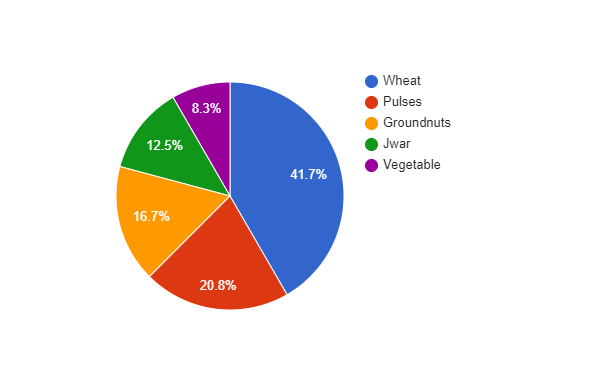
Question 7. Percentage of the different products of a village in a particular district are given below. Draw a pie chart representing this information.
| Items |
Wheat |
Pulses |
Jwar |
Groundnuts |
Vegetables |
Total |
| % |
125/3 |
125/6 |
25/2 |
50/3 |
25/3 |
100 |
Solution:
Given that, total % = 100%
Therefore,
Central angle = (component value/100) × 360°
Now the central angle for each activity will be calculated as follows :
| Items |
% |
Central Angle |
| Wheat |
125/3 |
(125/3)/100 * 360 = 150 |
| Pulses |
125/6 |
(125/6)/100 * 360 = 75 |
| Jwar |
25/2 |
(25/2)/100 * 360 = 45 |
| Groundnuts |
50/3 |
(50/3)/100 * 360 = 60 |
| Vegetables |
25/3 |
(25/3)/100 * 360 = 30 |
Steps to construct pie chart using above data :
Step 1. Draw the circle of an appropriate radius.
Step 2. Now draw a vertical radius anywhere inside the circle.
Step 3. Now choose the largest central angle. Construct a sector of central angle, whose one radius coincides with the radius drawn in step 2 and the other radius is in clockwise direction to the vertical radius.
Step 4. Construct other sectors representing other values in clockwise direction in descending order of values of their central angles.
Step 5. Shade the sectors so obtained by different colors and label them.
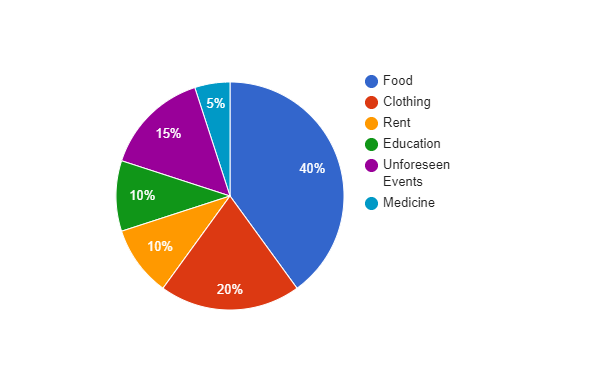
Question 8. Draw a pie diagram for the following data of expenditure pattern in a family :
| Items |
Food |
Clothing |
Rent |
Education |
Unforeseen Events |
Medicine |
| Expenditure (in %) |
40 |
20 |
10 |
10 |
15 |
5 |
Solution:
Given that, total % = 100%
Therefore,
Central angle = (component value/100) × 360°
Now the central angle for each activity will be calculated as follows :
| Items |
Expenditure (in %) |
Central Angle |
| Food |
40 |
40/100 * 360 = 144 |
| Clothing |
20 |
20/100 * 360 = 72 |
| Rent |
10 |
10/100 * 360 = 36 |
| Education |
10 |
10/100 * 360 = 36 |
| Unforeseen Events |
15 |
15/100 * 360 = 54 |
| Medicines |
5 |
5/100 * 360 = 18 |
Steps to construct pie chart using above data :
Step 1. Draw the circle of an appropriate radius.
Step 2. Now draw a vertical radius anywhere inside the circle.
Step 3. Now choose the largest central angle. Construct a sector of central angle, whose one radius coincides with the radius drawn in step 2 and the other radius is in clockwise direction to the vertical radius.
Step 4. Construct other sectors representing other values in clockwise direction in descending order of values of their central angles.
Step 5. Shade the sectors so obtained by different colors and label them.
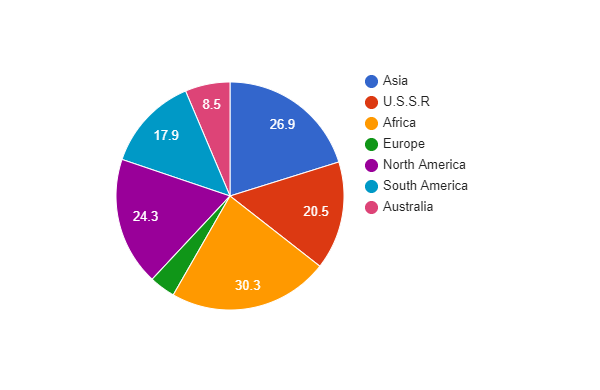
Question 9. Draw a pie diagram of the areas of continents of the world given in the following table:
| Continents |
Asia |
USSR |
Africa |
North America |
South America |
Europe |
Australia |
| Area (in million sq.km) |
26.9 |
20.5 |
30.3 |
24.3 |
17.9 |
4.9 |
8.5 |
Solution:
Given that, total Area = 133.3 million sq. km
Therefore,
Central angle = (component value/133.3) × 360°
Now the central angle for each activity will be calculated as follows :
| Continents |
Area (in million sq.km) |
Central Angle |
| Asia |
26.9 |
26.9/133.3 * 360 = 72.6 |
| USSR |
20.5 |
20.5/133.3 * 360 = 55.4 |
| Africa |
30.3 |
30.3/133.3 * 360 = 81.8 |
| Europe |
4.9 |
4.9/133.3 * 360 = 13.2 |
| North America |
24.3 |
24.3/133.3 * 360 = 65.6 |
| South America |
17.9 |
17.9/133.3 * 360 = 48..3 |
| Australia |
8.5 |
8.5/133.3 * 360 = 23 |
Steps to construct pie chart using above data :
Step 1. Draw the circle of an appropriate radius.
Step 2. Now draw a vertical radius anywhere inside the circle.
Step 3. Now choose the largest central angle and construct a sector of central angle, whose one radius coincides with the radius drawn in step 2 and the other radius is in clockwise direction to the vertical radius.
Step 4. Construct other sectors representing other values in clockwise direction in descending order of values of their central angles.
Step 5. Shade the sectors so obtained by different colors and label them.
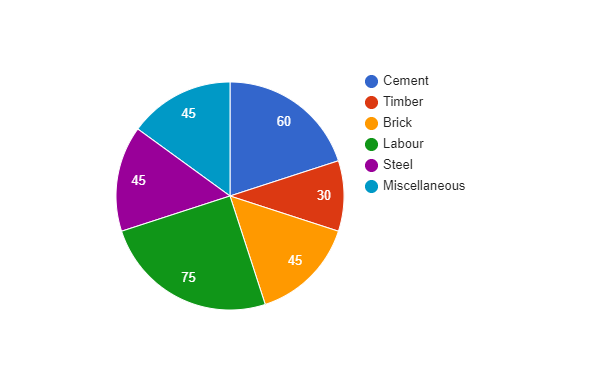
Question 10. The following data gives the amount spent on the construction of a house. Draw a pie diagram.
| Items |
Cement |
Timber |
Bricks |
Labors |
Steel |
Miscellaneous |
| Expenditure (in thousand Rs) |
60 |
30 |
45 |
75 |
45 |
45 |
Solution:
Given that, total Expenditure = 300 thousand rupees
Therefore,
Central angle = (component value/300) × 360°
Now the central angle for each activity will be calculated as follows :
| Items |
Expenditure (in thousand Rs) |
Central Angle |
| Cement |
60 |
60/300 * 360 = 72 |
| Timber |
30 |
30/300 * 360 = 36 |
| Bricks |
45 |
45/300 * 360 = 54 |
| Labors |
75 |
75/300 * 360 = 54 |
| Steel |
45 |
45/300 * 360 = 54 |
| Miscellaneous |
45 |
45/300 * 360 = 54 |
Steps to construct pie chart using above data :
Step 1. Draw the circle of an appropriate radius.
Step 2. Now draw a vertical radius anywhere inside the circle.
Step 3. Now choose the largest central angle and construct a sector of central angle, whose one radius coincides with the radius drawn in step 2 and the other radius is in clockwise direction to the vertical radius.
Step 4. Construct other sectors representing other values in clockwise direction in descending order of values of their central angles.
Step 5. Shade the sectors so obtained by different colors and label them.
Share your thoughts in the comments
Please Login to comment...