Change Theme Color in ggplot2 Plot in R
Last Updated :
24 Nov, 2023
In ggplot2, the appearance of plots is controlled by themes. A theme in ggplot2 is a collection of settings that control the non-data elements of the plot. These settings include things like background colors, grid lines, axis labels, and text sizes. we can use various theme-related functions to customize the appearance of your plots, including changing theme colors.
In this article, we are going to learn how to change theme color in the ggplot2 plot in R programming language.
ggplot2 Package
The ggplot2 package in R can be used to visualize the data. It can be used to plot the data points. It improves the readability of the plotted data. The package can be downloaded and installed into the working space using the following command :
install.packages("ggplot2")
Using ggplot() Change Theme Color in ggplot2 Plot in R
The ggplot() method can be used to create a plot of the data points. The points can be specified in the aesthetic mappings of the ggplot() method, wherein the x and y coordinates represent the column vectors of the data frame to be plotted.
Syntax: ggplot(df, aes = )
Arguments :
df – The data frame to be plotted.
aes – The aesthetic mappings.
Plotting graph using ggplot()
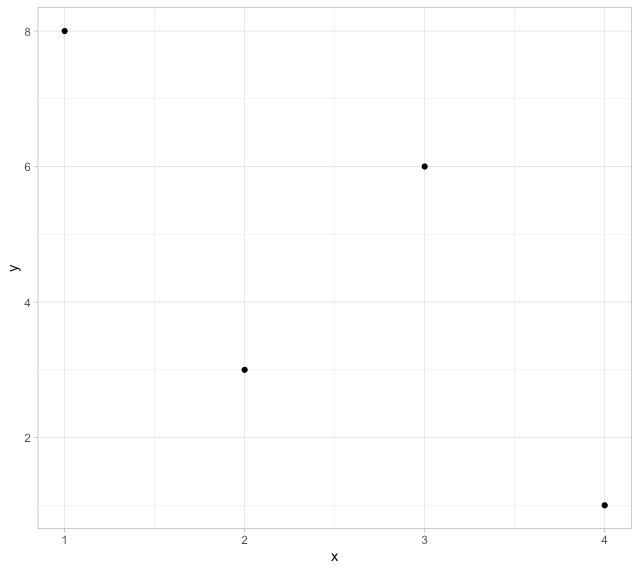
To plot a graph firstly we have to create a data frame using data.frame() method and then that data we are plotting the graph and a component of geom_point() is added to represent the data values as points in the graph as seen in the output.
R
library(ggplot2)
data_frame1 = data.frame(x= c(2,4,3,1),
y = c(3,1,6,8))
ggplot(data_frame1,aes(x = x , y =y)) +
geom_point()
|
Output:
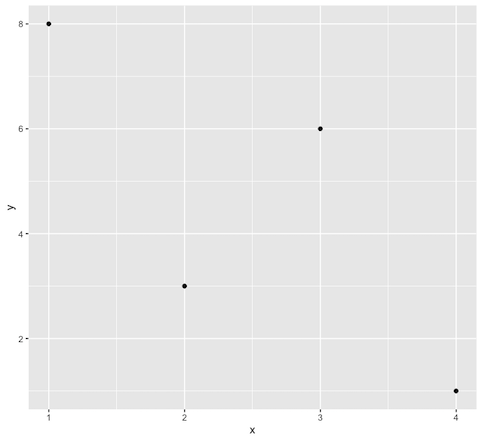
Change Theme Color in ggplot2 Plot in R
Changing theme color based on the background panel
The background color of the plot can be changed by using the theme function. It overrides the default theme parameters. The background theme can be changed using the following syntax :
Syntax: theme( panel.background = element_rect(fill = , color = ))
Parameters:
fill – The fill color for the rectangle
color – border color
size – border size
In this code, we are going to change the background color to green and the x-axis and y-axis color to blue using the panal.background in theme() method.
R
library(ggplot2)
data_frame1 = data.frame(x= c(2,4,3,1),
y = c(3,1,6,8))
ggplot(data_frame1,aes(x = x , y =y)) +
geom_point()+
theme(panel.background = element_rect(fill = 'green', color = 'blue'))
|
Output:
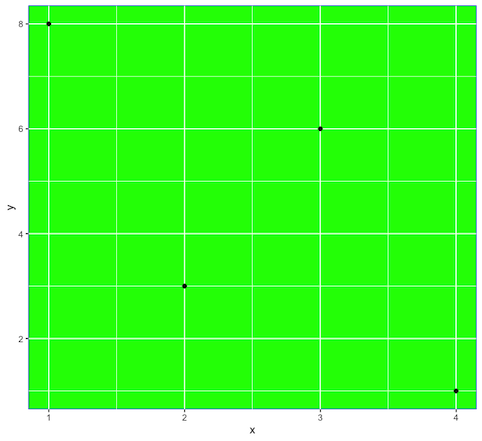
Change Theme Color in ggplot2 Plot in R
Changing theme color based on in-built themes
There are a large number of in-built themes in the ggplot which can be added as components to the existing plot. Let’s try some of them:
theme_linedraw(): This method is used to create black lines inside the plot.
R
library(ggplot2)
data_frame1 = data.frame(x= c(2,4,3,1),
y = c(3,1,6,8))
ggplot(data_frame1,aes(x = x , y =y)) +
geom_point()+
theme_linedraw()
|
Output:

Change Theme Color in ggplot2 Plot in R
theme_minimal(): This theme is used to remove background annotations.
R
library(ggplot2)
data_frame1 = data.frame(x= c(2,4,3,1),
y = c(3,1,6,8))
ggplot(data_frame1,aes(x = x , y =y)) +
geom_point()+
theme_minimal()
|
Output:
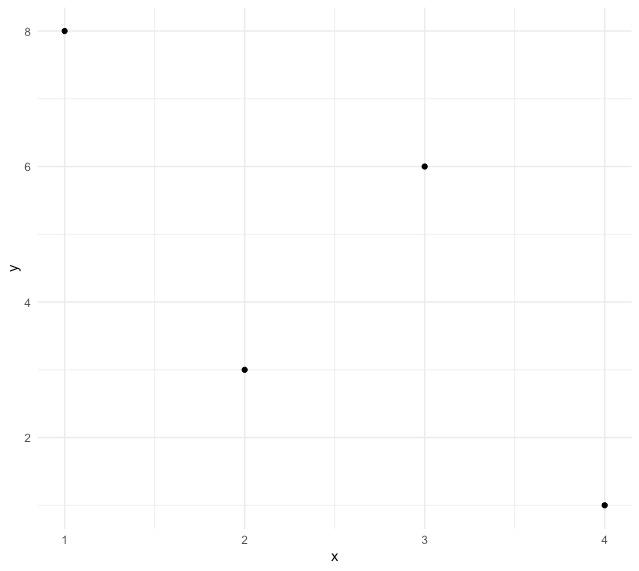
Change Theme Color in ggplot2 Plot in R
theme_dark(): It is used to create a dark background theme, as a result of which the elements of the graph are better popped out.
R
library(ggplot2)
data_frame1 = data.frame(x= c(2,4,3,1),
y = c(3,1,6,8))
ggplot(data_frame1,aes(x = x , y =y)) +
geom_point()+
theme_dark()
|
Output:
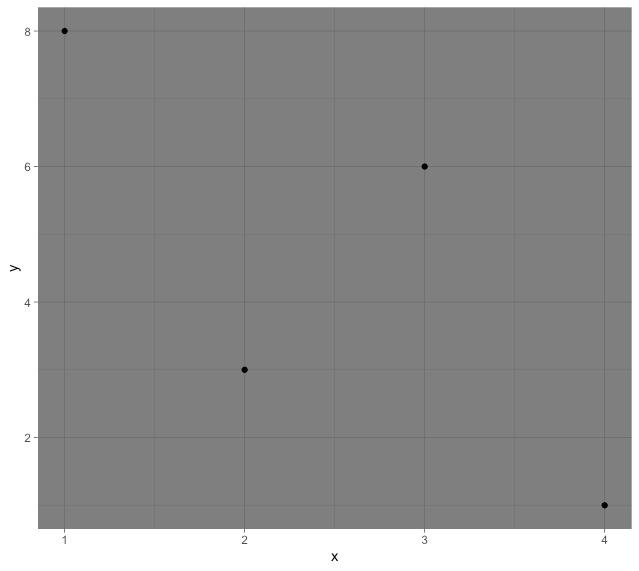
Change Theme Color in ggplot2 Plot in R
theme_void(): It is used to remove the background theme.
R
library(ggplot2)
data_frame1 = data.frame(x= c(2,4,3,1),
y = c(3,1,6,8))
ggplot(data_frame1,aes(x = x , y =y)) +
geom_point()+
theme_void()
|
Output:

Change Theme Color in ggplot2 Plot in R
theme_light(): It is used to plot the data in the form of light gray lines and an axis.
R
library(ggplot2)
data_frame1 = data.frame(x= c(2,4,3,1),
y = c(3,1,6,8))
ggplot(data_frame1,aes(x = x , y =y)) +
geom_point()+
theme_light()
|
Output:
Change Theme Color in ggplot2 Plot in R
Changing the color of plotted points in the plot
The geom_point() method takes as arguments the aesthetic mappings which can be used to modify the color of the points by specifying the color.
R
library(ggplot2)
data_frame1 = data.frame(x= c(2,4,3,1),
y = c(3,1,6,8))
ggplot(data_frame1,aes(x = x , y =y)) +
geom_point(aes(colour="red"))
|

Change Theme Color in ggplot2 Plot in R
These are some of the examples of main function which are used in ggplot2 package for Change Theme Color .Customizing the theme in ggplot2 allows us to create visually appealing and informative plots tailored to our specific needs.
Like Article
Suggest improvement
Share your thoughts in the comments
Please Login to comment...