Change the label size and tick label size of colorbar using Matplotlib in Python
Last Updated :
05 Nov, 2021
In this article, we will learn how to change the label size and tick label size of colorbar in Matplotlib using Python.
Labels are a kind of assigning name that can be applied to any node in the graph. They are a name only and so labels are either present or absent. To properly label a graph, helps to identify the x-axis and y-axis. Each tick mark represents a specified value of units on a continuous scale or the value of a category on a categorical scale. The X-axis and the Y-axis are noted on the graph.
Here we will discuss how to change the label size and tick label size of color-bar, using different examples to make it more clear.
Syntax:
# Change the label size
im.figure.axes[0].tick_params(axis=”both”, labelsize=21)
- axis = x, y or both.
- labelsize = int
# Change the tick label size of color-bar
im.figure.axes[1].tick_params(axis=””, labelsize=21)
- axis = x, y or both.
- labelsize = int
Example 1: In this example, we are changing the label size in Plotly Express with the help of method im.figure.axes[0].tick_params(axis=”both”, labelsize=21), by passing the parameters axis value as both axis and label size as 21.
Python3
import numpy as np
import matplotlib as mpl
import matplotlib.pyplot as plt
a = np.random.rand(10, 10)
im = plt.imshow(a, cmap="bwr")
cb = plt.colorbar(im, orientation='horizontal')
im.figure.axes[0].tick_params(axis="both", labelsize=21)
plt.show()
|
Output:

Example 2: In this Example, we are changing the label size in Plotly Express with the help of method im.figure.axes[0].tick_params(axis=”x”, labelsize=18), by passing the parameter axis value as x and label size as 18.
Python3
import numpy as np
import matplotlib as mpl
import matplotlib.pyplot as plt
a = np.random.rand(10, 10)
im = plt.imshow(a, cmap="bwr")
cb = plt.colorbar(im, orientation='horizontal')
im.figure.axes[1].tick_params(axis="x", labelsize=18)
plt.show()
|
Output:

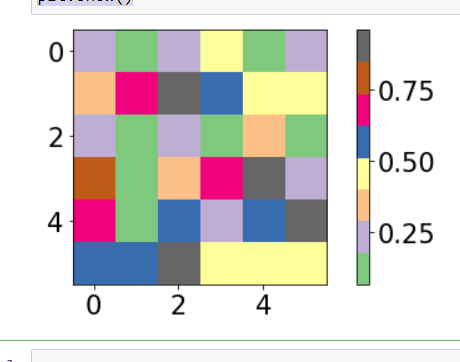
Example 3: In this example, we are changing the label size in Plotly Express with the help of method im.figure.axes[0].tick_params(axis=”y”, labelsize=21), bypassing the parameter axis value as y and label size as 21.
Python3
import numpy as np
from matplotlib import pyplot as plt
plt.rcParams["figure.figsize"] = [7.00, 3.50]
plt.rcParams["figure.autolayout"] = True
data = np.random.rand(6, 6)
im = plt.imshow(data, interpolation="nearest", cmap="Accent")
cbar = plt.colorbar(im)
im.figure.axes[0].tick_params(axis="both", labelsize=21)
im.figure.axes[1].tick_params(axis="y", labelsize=21)
plt.show()
|
Output:
Like Article
Suggest improvement
Share your thoughts in the comments
Please Login to comment...