Change Formatting of Numbers of ggplot2 Plot Axis in R
Last Updated :
30 Jun, 2021
In this article. we will discuss how to change the formatting of numbers of the ggplot2 plot axis in R Programming Language.
The ggplot() method can be used in this package in order to simulate graph customizations and induce flexibility in graph plotting.
Syntax:
ggplot(data = <DATA>, mapping = aes(<MAPPINGS>)) + <GEOM_FUNCTION>()
The data can be binded into the scatter plot using the data attribute of the ggplot method. The mapping in the function can be induced using the aes() function to create an aesthetic mapping, by filtering the variables to be plotted on the scatter plot. We can also specify how to depict different components in the graph, for instance, the x and y axes positions, the labels to assign to these points, or characteristics such as size, shape, color, etc.
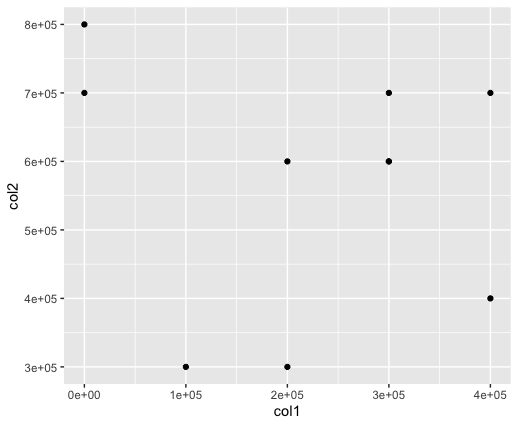
This method also allows the addition of various geoms- that is the components of the graph. geom_point() is used for the creation of a scatter plot. Large numbers are labeled across the axes using scientific notation for each of the numbers.
Example:
R
library(ggplot2)
library("scales")
set.seed(13482)
df <- data.frame(col1 = rpois(10,2)*100000,
col2 = rpois(10,5)*100000
)
print ("Original DataFrame")
print (df)
ggplot(df, aes(col1, col2)) +
geom_point()
|
Output
[1] "Original DataFrame"
    col1  col2
1  0e+00 8e+05
2  2e+05 3e+05
3  0e+00 7e+05
4  4e+05 7e+05
5  1e+05 3e+05
6  3e+05 7e+05
7  3e+05 6e+05
8  3e+05 6e+05
9  2e+05 6e+05
10 4e+05 4e+05
Now let us look at different ways in which numbers can be formatted.
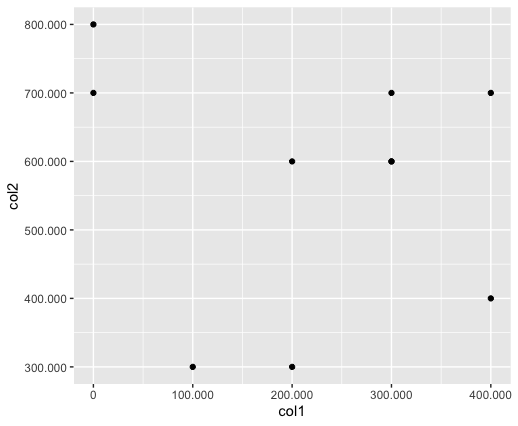
Method 1: Whole number representation
Formatting of axes labels is possible to convert the scientific notation to other formats. The scale_x_continuous() and scale_y_continuous() methods can be used to disable scientific notation and convert scientific labels to discrete form. The x and y parameters can be modified using these methods.
Syntax:
scale_x_continuous( name, labels)
scale_y_continuous( name, labels)
Parameter :
name – x or y axis labels
labels – labels of axis tick marks.
Example:
R
library(ggplot2)
library("scales")
set.seed(13482)
df <- data.frame(col1 = rpois(10,2)*100000,
col2 = rpois(10,5)*100000)
print ("Original DataFrame")
print (df)
ggplot(df, aes(col1, col2)) +
geom_point() +
scale_x_continuous(labels = comma) +
scale_y_continuous(labels = comma)
|
Output
[1] "Original DataFrame"
    col1  col2
1  0e+00 8e+05
2  2e+05 3e+05
3  0e+00 7e+05
4  4e+05 7e+05
5  1e+05 3e+05
6  3e+05 7e+05
7  3e+05 6e+05
8  3e+05 6e+05
9  2e+05 6e+05
10 4e+05 4e+05

Method 2 : Decimal representation
The scale_x_continuous() and scale_y_continuous() methods used to disable scientific notation can be customized further to support different formats to represent numbers on the axes. The comma_format() method can be used to format number with commas separating thousands.
Syntax:
comma_format( big.mark , decimal.mark)
Parameter :
big.mark – indicator of the mark between every big.interval decimals before the decimal point.
decimal.mark – indicator of the character to be used to indicate the decimal point.
Example:
R
library(ggplot2)
library("scales")
set.seed(13482)
df <- data.frame(col1 = rpois(10,2)*100000,
col2 = rpois(10,5)*100000
)
print ("Original DataFrame")
print (df)
ggplot(df, aes(col1, col2)) +
geom_point() +
scale_x_continuous(labels = comma_format(big.mark = ".",
decimal.mark = ","))+
scale_y_continuous(labels = comma_format(big.mark = ".",
decimal.mark = ","))
|
Output
[1] "Original DataFrame"
   col1  col2
1  0e+00 8e+05
2  2e+05 3e+05
3  0e+00 7e+05
4  4e+05 7e+05
5  1e+05 3e+05
6  3e+05 7e+05
7  3e+05 6e+05
8  3e+05 6e+05
9  2e+05 6e+05
10 4e+05 4e+05
Like Article
Suggest improvement
Share your thoughts in the comments
Please Login to comment...