Change Font Size of ggplot2 Facet Grid Labels in R
Last Updated :
08 Dec, 2021
In this article, we will see how to change font size of ggplot2 Facet Grid Labels in R Programming Language.
Let us first draw a regular plot without any changes so that the difference is apparent.
Example:
R
library("ggplot2")
DF <- data.frame(X = rnorm(20),
Y = rnorm(20),
group = c("Label 1", "Label 2",
"Label 3", "Label 4"))
ggplot(DF, aes(X, Y)) +
geom_point(size = 5, fill = "green",
color = "black", shape = 21) +
facet_grid(group ~ .)
|
Output :

Faceted ScatterPlot using ggplot2
By default, the size of the label is given by the Facets, here it is 9. But we can change the size. For that, we use theme() function, which is used to customize the appearance of plot. We can change size of facet labels, using strip.text it should passed with value to produce labels of desired size.
Syntax : theme(strip.text)
Parameter :
- strip.text : For customize the Facet Labels. For horizontal facet labels ‘strip.text.x’ & for vertical facet labels ‘strip.text.y’ is used. this function only takes element_text() function as it’s value. We have to assign factors that we want to modify to element_text .
Return : Theme of the plot.
element_text is a theme element of text, which modify the style or theme of text. It has many parameters for different styles of text. size is one out of them, which changes the size of text.
Syntax : element_text(size, color)
Parameters :
Return : Change the style of Text.
We can both increase and decrease the size. Let us first see the increased version.
Example 1 :
R
library("ggplot2")
DF <- data.frame(X = rnorm(20),
Y = rnorm(20),
group = c("Label 1", "Label 2",
"Label 3", "Label 4"))
ggplot(DF, aes(X, Y)) +
geom_point(size = 5, fill = "green",
color = "black", shape = 21) +
facet_grid(group ~ .)+
theme(strip.text = element_text(
size = 20, color = "dark green"))
|
Output :
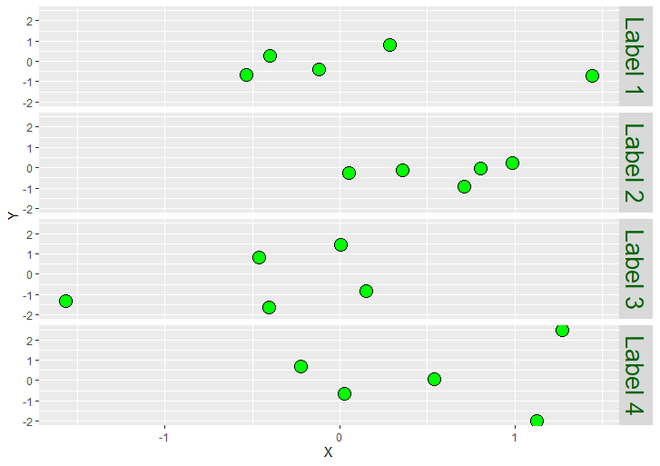
Increased Facet Label Size
Now lets see the decreased one.
Example 2:
R
library("ggplot2")
DF <- data.frame(X = rnorm(20),
Y = rnorm(20),
group = c("Label 1", "Label 2",
"Label 3", "Label 4"))
ggplot(DF, aes(X, Y)) +
geom_point(size = 5, fill = "green",
color = "black", shape = 21) +
facet_grid(group ~ .)+
theme(strip.text = element_text(
size = 5, color = "dark green"))
|
Output :
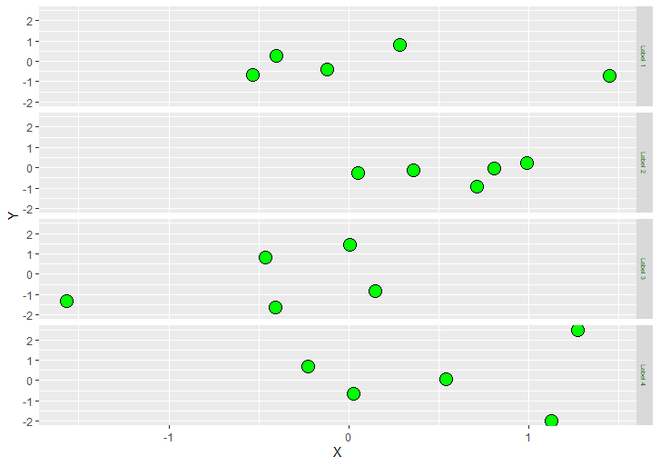
Decreased Facet Label size
Like Article
Suggest improvement
Share your thoughts in the comments
Please Login to comment...