Change figure size in Pandas – Python
Last Updated :
11 Dec, 2020
Prerequisites: Pandas
The size of a plot can be modified by passing required dimensions as a tuple to the figsize parameter of the plot() method. it is used to determine the size of a figure object.
Syntax:
figsize=(width, height)
Where dimensions should be given in inches.
Approach
- Import pandas.
- Create or load data
- Call the plot() function with a figsize parameter along with dimensions.
Example 1
Python3
import pandas as pd
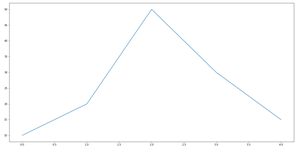
data1 = [10, 20, 50, 30, 15]
s1 = pd.Series(data1)
s1.plot(figsize=(20, 10))
|
Output:
Example 2
Python3
import pandas as pd
df = pd.DataFrame({'names': ['A', 'B', 'C', 'D'], 'val': [10, 45, 30, 20]})
df.plot.bar(x='names', y='val', rot=0, figsize=(15, 10))
|
Output :

Example 3
Python3
import pandas as pd
df = pd.DataFrame({'value': [3.330, 4.87, 5.97]},
index=['Item 1', 'Item 2', 'Item 3'])
df.plot.pie(y='value', figsize=(5, 5))
|
Output :

Like Article
Suggest improvement
Share your thoughts in the comments
Please Login to comment...