CDN Analytics with Azure Data Explorer
Last Updated :
30 Mar, 2023
Azure CDN is a distributed network of servers that delivers online information to consumers quickly and effectively. To reduce latency, CDNs cache content on edge servers located near end users. Often, a CDN is used for distributing static resources to client applications, which is typically done via a website. The application might produce things at runtime and make them accessible to the CDN (for example, by building a list of current news headlines), but it does not do so for each request.
CDN Logs:
Content Delivery Networks produce vast volumes of log Files when they transmit video over the internet to our homes and Mobile devices. These logs include essential information regarding the operation of the CDN servers and the quality of the video streaming. These logs range into terabytes of data and managing this amount of data in real-time and applying analytics to understand customer experience and network faults needs the right tools.
Depending on which CDN provider you use, accessing the logs will be different:
- The Log Delivery Service from Akamai (Data Visualization Tool) allows you to gather logs from their edge cache servers.
- To extract logs Fastly offers its own log streaming method.
- Many common AWS technologies, such as S3 and Kinesis, are integrated with Amazon CloudFront to provide real-time access logs.
- Cloudflare offers two services: Logpush, which lets you select where your logs should be transmitted, and Logpull, which lets you query logs anytime you want.
- Azure CDN also provides raw access logs as well as metrics to help track, troubleshoot, and debug issues.
Azure Data Explorer allows you to ingest raw logs and traces and analyze the data by parsing, filtering, and aggregating the data very performantly. This example will show you the sort of information that is generally accessible in your CDN logs and explain how to analyze them:
90.54.15.123 username [23/Dec/2021:13:55:36 +0000]
“GET /photo.jpg HTTP/2.0” 200 132 3445
- IP address (90.5 4.15.123):- This is the IP address of the user. Knowing the IP address can help you analyze a large number of requests coming from the same user. This can be useful for detecting suspicious activity.
- Username (username):- This indicates the username passed in the request. Service providers can decode the authorization header to pull out the username. In a basic authentication request, a username and password are encoded. In an event of suspicious activity, service providers can use it to track and block the user.
- Timestamp (23/Dec/2021:13:55:36 +0000):- As the name implies, this part of the log specifies when the request was sent. Timestamps can be helpful for analyzing sudden spikes in traffic.
- Request line (“GET /photo.jpg HTTP/2.0”):- The HTTP GET status used in this query indicates that a user made a request to the server. To send data to the server HTTP POST is used.
- HTTP Status (200):- The server’s HTTP status tells you if it was able to complete a request. A status code followed by a 2 indicates a successful response whereas status codes starting with 4 indicate that the request couldn’t be completed. For example, a 404 status code indicates that the requested page isn’t available.
- Latency (132):- Latency is the amount of time it takes for you to respond to a request that reaches your CDN. Spikes in latency can indicate a slowdown in response. This makes it a crucial metric to monitor.
- Response size (3445):- A big response size indicates that the server has to do more work. Understanding the response size can help the service providers understand the load on the application.
CDN Analytics With Azure Data Explorer:
This solution illustrates low-latency high-throughput ingestion for massive amounts of CDN logs for constructing near real-time analytics dashboards.
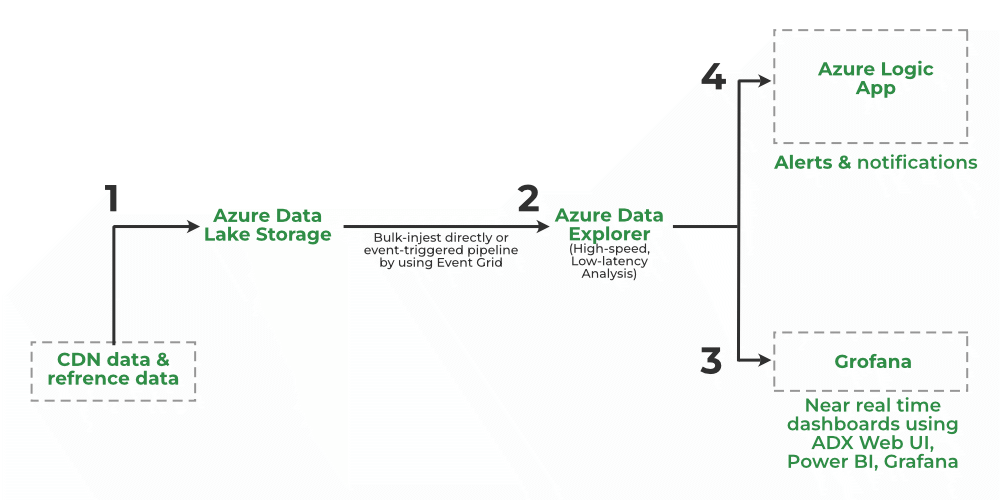
- CDN providers such as Verizon and Fastly ingest massive volumes of CDN logs into ADX to assess the latency, health, and performance of CDN assets.
- Most CDN implementations import data using Azure Storage (Blob or Azure Data Lake Storage Gen2), which uses Azure Event Grid and starts the ingestion pipeline to ADX. Alternatively, you can bulk ingest the data using the LightIngest tool. You can also continually export data to Azure Storage in compressed, partitioned Parquet format and easily query that data.
- ADX enables easy-to-use native operators and functions to process, aggregate, and analyze time series and log data, as well as give insights at lightning speed. You can develop near real-time analytics dashboards using ADX dashboards, Power BI, or Grafana.
- Create and schedule alerts and notifications using an ADX connection for Azure Logic Apps.
CDN logs are sources of information that can help you better understand your users’ behavior, your company’s performance, and the frequency of fraudulent requests that come to your website. These insights are essential for learning and developing your service in order to scale safely and accomplish your goals. ADX provides an innovative query language, that is optimized for high-performance data analytics and is perfect for analyzing massive amounts of raw unstructured logs. If you have raw data already collected by logging systems, to demonstrate the real value that can be extracted from semi-structured data, ADX can be used to explore the raw data. In the final chapter, we will see how ADX can serve as a centralized analytics platform for logs.
Like Article
Suggest improvement
Share your thoughts in the comments
Please Login to comment...