Calculation of Mode in Discrete Series | Formula of Mode
Last Updated :
23 Feb, 2024
What is Mode?
The word mode comes from the Latin word ‘Modus’, meaning measurements, quantity, way, or manner. In statistics, Mode refers to the variable that occurs most of the time or repeats itself most frequently in a given series of variables (say X). It is a maximum occurrence at a particular point or a value, and one of the three measures of central tendency in statistics that aims to analyze and examine data given in categories like the colour of cars, design of handbags, etc. The mode can be determined in two series, viz., individual series and discrete series. It is denoted as ‘Z’.
What is Discrete Series?
Discrete series shows the number of times each variable is being repeated, known as the frequency of variable. In simple, discrete series shows the variables along with their corresponding frequency. A discrete series does not involve class intervals, rather, in discrete series, variables are always presented corresponding to their frequency value. Data in discrete series are presented in tabular form.
Example of Discrete Series
If 3 students score 60 marks, 9 students score 70 marks, 5 students score 80 marks, and 2 students score 90 marks, then this information will be shown as:
|
Marks
|
Number of Students
|
|
60
|
3
|
|
70
|
9
|
|
80
|
5
|
|
90
|
2
|
Methods of Calculating Mode in Discrete Series
There are two Methods of Calculating Mode in Discrete Series:
- Inspection Method
- Grouping Method
1. Inspection Method
Under the Inspection method, the value of mode is simply calculated by observing the given series of the variable. The variable that repeats or occurs the maximum number of times is considered to be the Mode value for that series. It is one of the easiest and simplest methods of determining mode when the data set is not large.
Calculation of Mode using Inspection Method in case of Discrete Series
The frequency value given beside each variable represents the number of times that variable occurs in a given series. Under this method, we have to carefully observe the given series to find out the variable/variables with the highest frequency. Variable or variables with the highest frequency value will be the Mode for the given series.
Example: Find the mode for the given discrete series:
It is visible that variable 20 has the highest frequency value of 8. Therefore,
Mode (Z) = 20
2. Grouping Method
Sometimes it becomes impossible to determine the mode by inspection method when the frequency distribution is not regular, or the concentration of frequencies does not follow a unique pattern, or where more than one variable shows the highest frequency value. Under such a situation, the Grouping Method of calculating mode is used. In the grouping method, frequencies are grouped to get a unique pattern and two tables are prepared to determine the mode, viz., The Grouping Table and The Analysis Table.
Calculation of Mode using Grouping Method in case of Discrete Series
Grouping Table
Prepare 6 columns in addition to the column of variable (X) and then form groups according to the following instructions:
- Firstly, take the given frequencies in column 1.
- Then take the sum of frequencies in two(s) in column 2.
- Now in column 3, take the sum of frequencies in two(s), starting from the second value of the given frequencies.
- Take the sum of frequencies in three(s) in column 4.
- In column 5, take the sum of frequencies in three(s), starting from the second value of the given frequencies.
- Lastly, in column 6, take the sum of frequencies in three(s), starting from the third value of the given frequencies.
After preparing all six columns, underline, circle, or highlight the maximum frequency (maximum total) of each column.
Analysis Table
- First, prepare another table showing all the six columns vertically and all the given values of the variable (X) horizontally.
- Now according to the Grouping Table, mark (✓) under that variable which is the part of the maximum total of the column under consideration.
- Repeat the process for each of the columns and mark (✓) under the concerned variable.
- Now count the mark (✓) of each column in the Analysis Table.
- The variable with a maximum number of ticks (✓) is determined to be Mode for the given series, i.e., the variable forming most of the highest grouped frequencies is determined as a value of mode.
Example: Find the mode for the given discrete series:
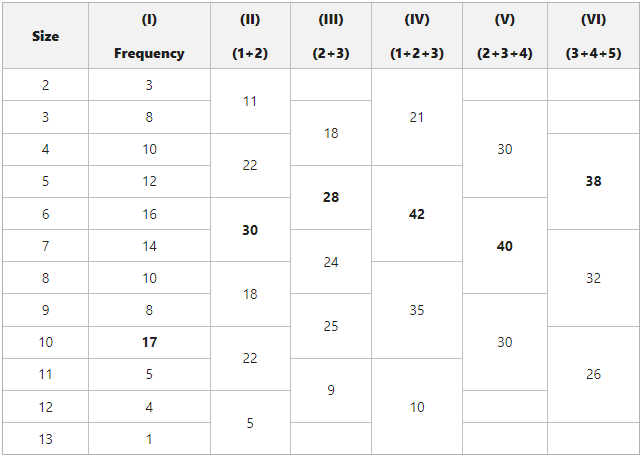
Grouping Table
- Column (I) shows the frequency of the given series, and 17 is marked as the highest value.
- Column (II) shows the sum of frequencies in two(s), i.e., [3+8=11, 10+12=22, 16+14+30, 10+8=18, 17+5=22, and 4+1=5]. In this column, the highest value marked is 30.
- Column (III) shows the sum of frequencies in two(s), starting from the second value of given frequencies, i.e., [8+10=18, 12+16=28, 14+10=24, 8+17=25, and 5+4=9]. The highest value marked is 28.
- Column (IV) shows the sum of frequencies in three(s), i.e., [3+8+10=21, 12+16+14=42, 10+8+17=35, and 5+4+1=10]. In this column, the highest value marked is 42.
- Column (V) shows the sum of frequencies in three(s), starting from the second value of given frequencies, i.e., [8
+10+12=30, 16+14+10=40, and 8+17+5=30]. The highest value marked is 40.
- Column (VI) shows the sum of frequencies in three(s), starting from the third value of given frequencies, i.e., [10+12+16=38, 14+10+8=32, and 17+5+4=26]. The highest value marked is 38.
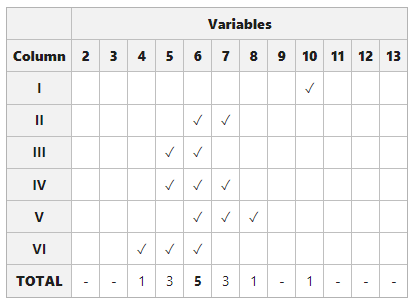
Analysis Table
- 17 is the highest value in the first column, corresponding to variable value 10. So, we have marked (✓) under 10 in the analysis table.
- In the second column, the highest value marked is 30, and it is the sum of 16 and 14, i.e., corresponding to variable values 6 and 7. Therefore, we have marked (✓) under 6 and 7.
- In the third column, the highest value marked is 28, and it is the sum of 12 and 16, i.e., corresponding to variable values 5 and 6. Therefore, we have marked (✓) under 5 and 6.
- In the fourth column, the highest value marked is 42, and it is the sum of 12, 16 and 14, i.e., corresponding to variable values 5, 6 and 7. Therefore, we have marked (✓) under 5, 6 and 7.
- In the fifth column, the highest value marked is 40, and it is the sum of 16, 14 and 10, i.e., corresponding to variable values 6, 7 and 8. Therefore, we have marked (✓) under 6, 7 and 8.
- In the sixth column, the highest value marked is 38, and it is the sum of 10, 12 and 16, i.e., corresponding to variable values 4, 5 and 6. Therefore, we have marked (✓) under 4, 5, and 6.
According to the analysis table, the highest number of ticks(✓) is against the variable 6. Therefore,
Mode (Z) = 6.
Like Article
Suggest improvement
Share your thoughts in the comments
Please Login to comment...