Browser Developer Tools
Last Updated :
27 Jan, 2021
Every web-developer needs some basic set of tools for understanding the underlying structure of the code and enables us to inspect the web content. Developer tools are built directly into the browser. These are the tools that are browser dependent. Most of these tools are common among various browsers and do a range of things, from inspecting elements of a currently-loaded HTML, CSS, and JavaScript. With developer tools, we can directly interact with the source code that is fetched into the client side of our system. This article will explain such basic functionality of the browser’s devtools.
Across all browsers, the basic functionality of the developer tools remains the same, only naming conventions and terminologies changes. In this article, we would be focusing the majority of sections on two popular browsers Firefox and Chrome.
How to open DevTools in the browser
There are many ways to open the Browser Developer Tools.
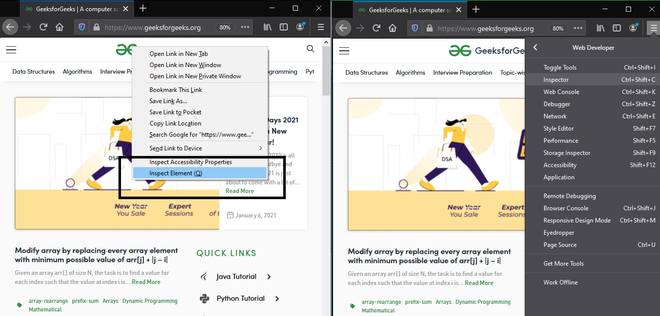
- To access the DOM or CSS of the webpage, right-click the desired element on the page and select Inspect. Or press Command+Option+C (Mac), Control+Shift+C/I (Windows, Linux, Chrome OS), or press F12 (Internet Explorer, Edge).
1. Inspector
The Inspector tool allows you to see the HTML, CSS of the webpage that you are currently inspecting. With it, you can check what CSS is applied to each element on the page. It also allows you to preview instant changes to the HTML and CSS which are reflected live in the browser. These changes are not permanent and are reset once you refresh the browser window.

- Edit as HTML (Add attribute/Edit text): This allows to change the HTML and see the results in real-time. Most useful for debugging and testing.
- Create Node: Create another empty inner division.
- Duplicate Node: Create an exact copy of the division, along with the same attributes.
- Delete Node: Deletes the current element.
- Copy/ Copy as HTML: Copy HTML which is currently selected.
- Change Pseudo-Class (:hover/:active/:focus): It forces element states to be toggled on. Enabling us to view the particular styling on the element.
- Copy CSS Path/ Copy XPath: Most useful feature of Inspector (feature could be enabled manually) it allows to copy the CSS selector or XPath expression, this selects the current HTML element.
Application:
- Viewing and changing the DOM/ CSS
- Inspect and change HTML Pages.
- Inspect animations
- Find unused CSS.
2. Console
The console is used for debugging JavaScript present in the source code of the webpage. The console window act as our debug window that allows us to handle JavaScript that isn’t working as expected. It allows you to either run a code block or single lines of JavaScript against the page which is currently loaded in the browser. The console reports the errors which are encountered by the browser as it tries to execute the code.

- The console recognized the correct syntax and generated an alert message corresponding to the JavaScript Code.
- It also recognized type errors and gave us an error message for the wrong syntax.
Application:
- Viewing logged messages
- Running JavaScript
- Preserve Log
- Group similar elements
- Log XmlHttpRequests
- Preserving live expression
3. Debugger(Firefox)/ Sources(Chrome)
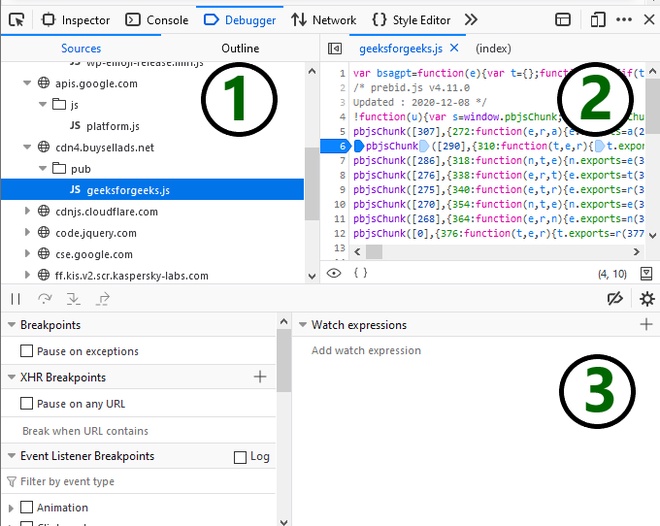
The Sources/Debugger UI panel watches JavaScript code and allows you to set breakpoints and watch the value of variables. Breakpoints are set at the places in the code where we want to pause the execution cycle and debug or identify the problems with the execution. With this panel, you debug the JavaScript.
This panel has three parts:
1. File list(Firefox)/ File Navigator(Chrome): Lists every file associated with the page that we are debugging.
2. Source code(Firefox)/ Code Editor(Chrome): Contents of the selected file is displayed in this panel. Breakpoints could also be set in this panel, where we want to pause execution.
3. Watch expressions and breakpoints: These are the tools for inspecting the JavaScript of the page.
There are two more sections that only appear when the code is running.
4. Call Stack: It shows you what code was executed to get to the current line.
5. Scopes: It shows the values which are visible from a different perspective from within the given code.
Application:
- Pause code with breakpoints.
- Save changes to disk with workspaces.
- Run snippets of code from any page.
- Find unused JavaScript.
- Persist changes across page reloads with local overrides.
- Get a JavaScript debugging reference.
3. Network Monitor
A Network panel is used to make sure what all resources that are being downloaded or uploaded are being done as expected. It enables us to view the network requests made when a page is loaded. It tells how long each request takes, and details of each request. The monitor is empty when it is loaded, the logs are created once any action is performed while the monitor is open.
Each row of Network Logs does represent a list of resources. These resources are listed according to the following structure:
- Status: The HTTP response code.
- Type: The resource type.
- Initiator: The Initiator column is a hyperlink that takes you to the source code of the request.
- Time: Time is taken by the request.
- Timeline/ Waterfall: Graphical representation of the various stage of these requests.

Application:
- Inspecting the properties of an individual resource (HTTP headers, content, size).
- Checking Network request list
- View Network traffic recording
- Creating Performance analysis
- Inspecting web sockets
- Inspecting server-sent events
- To throttle the network speed
4. Performance Tools
Performance is recorded at runtime and tells how the page performs when it is running, as opposed to loading. The tool gives a general insight into how good is the site’s general responsiveness. It also measures the JavaScript & layout performance of the site. The tool creates a recording/ profile, of the website over a period of time, the tool is made to run. An overview is created using the RAIL model, listing all the frames of the browser activity which has been done to render the website.

Application:
- Simulating a mobile CPU
- Recording runtime performance of our site
- Analyzing frame per second
- Finding the bottleneck capacity
- Animating CSS properties
5. Accessibility Inspector
This tool provides a way to access important information which is generally exposed to the assistive tech stack on the current view page via the accessibility tree present. It allows checking what element is missing or otherwise needs attention.
Accessibility is the practice of creating websites usable by as many of us, as much as possible. This tool tries the best to not prevent anyone from accessing information due to any kind of disability. Disability also includes any feature that a user is not able to use due to the lack of capabilities of the device which is being used to access the site. This may include the speed of their network connection, or their geographic location or locale.

The accessibility window is present as a tree diagram, representing all the items on the current page. Items having the nested children got these arrows that can be clicked to reveal the nesting level with the children.
Applications:
- Fully keyboard controllable
- Print accessibility tree to JSON
- Show web page tabbing order
- Check for accessibility issues
- Simulate the webpage if viewed by a color-blind person
- Highlighting of UI items
- Check whether the item has the correct role set to it
We have discussed the 5 main tools present inside the browser DevTool panel that is most frequently used by any user. These tools are important for development as well from a testing and debugging point of view. Hence, it is always known to have such basic development and debugging tools, this would ease it
Conclusion:
Browser DevTools are very useful and important tools for web development. The ability to work directly within a browser in real-time helps a lot in easing out the development process. With these tools we can take leverage of their wide range of applications to preview style changes, alter the HTML or help write JavaScript code and do some debugging. There are so many more ways to use these listed DevTools and the possibilities are endless. Hence, it is always encouraged to try each and every tool present, as each tool opens up a whole other dimension of Web-Development.
Like Article
Suggest improvement
Share your thoughts in the comments
Please Login to comment...