Bresenham’s Algorithm for 3-D Line Drawing
Last Updated :
20 Feb, 2023
Given two 3-D co-ordinates we need to find the points on the line joining them. All points have integer co-ordinates. Examples:
Input  : (-1, 1, 1), (5, 3, -1)
Output : (-1, 1, 1), (0, 1, 1), (1, 2, 0),
          (2, 2, 0), (3, 2, 0), (4, 3, -1),
          (5, 3, -1)
Input  : (-7, 0, -3), (2, -5, -1)
Output : (-7, 0, -3), (-6, -1, -3), (-5, -1, -3),
         (-4, -2, -2), (-3, -2, -2), (-2, -3, -2),
         (-1, -3, -2), (0, -4, -1), (1, -4, -1),
          (2, -5, -1)
Bresenham’s Algorithm is efficient as it avoids floating point arithmetic operations. As in the case of 2-D Line Drawing, we use a variable to store the slope-error i.e. the error in slope of the line being plotted from the actual geometric line. As soon as this slope-error exceeds the permissible value we modify the digital to negate the error.
The driving axis of the line to be plotted is the one along which the line travels the farthest i.e. the difference in axes co-ordinates is greatest. Thus the co-ordinate values increase linearly by 1 along the driving axis and the slope-error variable is used to determine the change in the co-ordinate values of the other axis.
In case of a 2-D line we use one slope-error variable but in case of a 3-D line we need two ( ) of them for each of the non-driving axes. If current point is
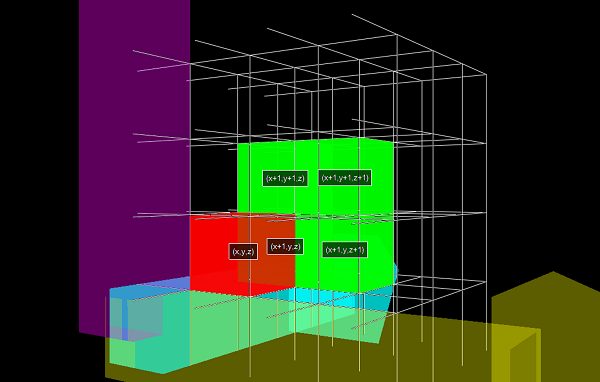
  (x, y, z) and the driving axis is the positive X-axis, then the next point
  could be
- (x+1, y, z)
- (x+1, y+1, z)
- (x+1, y, z+1)
- (x+1, y+1, z+1)
The value of slope-error variables are determined according to the following equations:- 
The initial value of slope-error variables are given by the following equations:-  Here
Here  denote the difference in co-ordinates of the two end points along the X, Y, Z axes.
Algorithm:-
- Input the two endpoints and store the initial point as

- Plot
- Calculate constants and determine the driving axis by comparing the absolute values of If abs(
 ) is maximum, then X-axis is the driving axis If abs(
 ) is maximum, then Y-axis is the driving axis If abs(
 ) is maximum, then Z-axis is the driving axis
 - Let’s suppose that X-axis is the driving axis, then

- At each
 along the line, starting at k = 0, check the following conditions and determine the next point:-
- If
 AND
AND  , then plot
  and set
- Else If
 AND , then plot
  and set
- Else If
 , then plot
  and set
- Else then plot
 and set
  >
>
- Repeat step 5
 times
times
C++
#include <cmath>
#include <iostream>
#include <vector>
using namespace std;
vector<vector<int> > Bresenham3D(int x1, int y1, int z1,
int x2, int y2, int z2)
{
vector<vector<int> > ListOfPoints;
ListOfPoints.push_back({ x1, y1, z1 });
int dx = abs(x2 - x1);
int dy = abs(y2 - y1);
int dz = abs(z2 - z1);
int xs;
int ys;
int zs;
if (x2 > x1)
xs = 1;
else
xs = -1;
if (y2 > y1)
ys = 1;
else
ys = -1;
if (z2 > z1)
zs = 1;
else
zs = -1;
if (dx >= dy && dx >= dz) {
int p1 = 2 * dy - dx;
int p2 = 2 * dz - dx;
while (x1 != x2) {
x1 += xs;
if (p1 >= 0) {
y1 += ys;
p1 -= 2 * dx;
}
if (p2 >= 0) {
z1 += zs;
p2 -= 2 * dx;
}
p1 += 2 * dy;
p2 += 2 * dz;
ListOfPoints.push_back({ x1, y1, z1 });
}
}
else if (dy >= dx && dy >= dz) {
int p1 = 2 * dx - dy;
int p2 = 2 * dz - dy;
while (y1 != y2) {
y1 += ys;
if (p1 >= 0) {
x1 += xs;
p1 -= 2 * dy;
}
if (p2 >= 0) {
z1 += zs;
p2 -= 2 * dy;
}
p1 += 2 * dx;
p2 += 2 * dz;
ListOfPoints.push_back({ x1, y1, z1 });
}
}
else {
int p1 = 2 * dy - dz;
int p2 = 2 * dx - dz;
while (z1 != z2) {
z1 += zs;
if (p1 >= 0) {
y1 += ys;
p1 -= 2 * dz;
}
if (p2 >= 0) {
x1 += xs;
p2 -= 2 * dz;
}
p1 += 2 * dy;
p2 += 2 * dx;
ListOfPoints.push_back({ x1, y1, z1 });
}
}
return ListOfPoints;
}
int main()
{
int x1 = -1;
int y1 = 1;
int z1 = 1;
int x2 = 5;
int y2 = 3;
int z2 = -1;
vector<vector<int> > ListOfPoints
= Bresenham3D(x1, y1, z1, x2, y2, z2);
cout << "The generated points are:" << endl;
for (auto it : ListOfPoints)
cout << it[0] << " " << it[1] << " " << it[2]
<< endl;
return 0;
}
|
Java
import java.util.ArrayList;
import java.util.List;
public class Bresenham3D {
public static List<List<Integer>> Bresenham3D(int x1, int y1, int z1, int x2, int y2, int z2) {
List<List<Integer>> ListOfPoints = new ArrayList<>();
ListOfPoints.add(List.of(x1, y1, z1));
int dx = Math.abs(x2 - x1);
int dy = Math.abs(y2 - y1);
int dz = Math.abs(z2 - z1);
int xs;
int ys;
int zs;
if (x2 > x1) {
xs = 1;
} else {
xs = -1;
}
if (y2 > y1) {
ys = 1;
} else {
ys = -1;
}
if (z2 > z1) {
zs = 1;
} else {
zs = -1;
}
if (dx >= dy && dx >= dz) {
int p1 = 2 * dy - dx;
int p2 = 2 * dz - dx;
while (x1 != x2) {
x1 += xs;
if (p1 >= 0) {
y1 += ys;
p1 -= 2 * dx;
}
if (p2 >= 0) {
z1 += zs;
p2 -= 2 * dx;
}
p1 += 2 * dy;
p2 += 2 * dz;
ListOfPoints.add(List.of(x1, y1, z1));
}
} else if (dy >= dx && dy >= dz) {
int p1 = 2 * dx - dy;
int p2 = 2 * dz - dy;
while (y1 != y2) {
y1 += ys;
if (p1 >= 0) {
x1 += xs;
p1 -= 2 * dy;
}
if (p2 >= 0) {
z1 += zs;
p2 -= 2 * dy;
}
p1 += 2 * dx;
p2 += 2 * dz;
ListOfPoints.add(List.of(x1, y1, z1));
}
} else {
int p1 = 2 * dy - dz;
int p2 = 2 * dx - dz;
while (z1 != z2) {
z1 += zs;
if (p1 >= 0) {
y1 += ys;
p1 -= 2 * dz;
}
if (p2 >= 0) {
x1 += xs;
p2 -= 2 * dz;
}
p1 += 2 * dy;
p2 += 2 * dx;
ListOfPoints.add(List.of(x1, y1, z1));
}
}
return ListOfPoints;
}
public static void main(String[] args) {
int x1 = -1;
int y1 = 1;
int z1 = 1;
int x2 = 5;
int y2 = 3;
int z2 = -1;
List<List<Integer>> ListOfPoints = Bresenham3D(x1, y1, z1, x2, y2, z2);
System.out.println("The generated points are:");
for (List<Integer> it : ListOfPoints) {
System.out.println(it.get(0) + " " + it.get(1) + " " + it.get(2));
}
}
}
|
Python3
def Bresenham3D(x1, y1, z1, x2, y2, z2):
ListOfPoints = []
ListOfPoints.append((x1, y1, z1))
dx = abs(x2 - x1)
dy = abs(y2 - y1)
dz = abs(z2 - z1)
if (x2 > x1):
xs = 1
else:
xs = -1
if (y2 > y1):
ys = 1
else:
ys = -1
if (z2 > z1):
zs = 1
else:
zs = -1
if (dx >= dy and dx >= dz):
p1 = 2 * dy - dx
p2 = 2 * dz - dx
while (x1 != x2):
x1 += xs
if (p1 >= 0):
y1 += ys
p1 -= 2 * dx
if (p2 >= 0):
z1 += zs
p2 -= 2 * dx
p1 += 2 * dy
p2 += 2 * dz
ListOfPoints.append((x1, y1, z1))
elif (dy >= dx and dy >= dz):
p1 = 2 * dx - dy
p2 = 2 * dz - dy
while (y1 != y2):
y1 += ys
if (p1 >= 0):
x1 += xs
p1 -= 2 * dy
if (p2 >= 0):
z1 += zs
p2 -= 2 * dy
p1 += 2 * dx
p2 += 2 * dz
ListOfPoints.append((x1, y1, z1))
else:
p1 = 2 * dy - dz
p2 = 2 * dx - dz
while (z1 != z2):
z1 += zs
if (p1 >= 0):
y1 += ys
p1 -= 2 * dz
if (p2 >= 0):
x1 += xs
p2 -= 2 * dz
p1 += 2 * dy
p2 += 2 * dx
ListOfPoints.append((x1, y1, z1))
return ListOfPoints
def main():
(x1, y1, z1) = (-1, 1, 1)
(x2, y2, z2) = (5, 3, -1)
ListOfPoints = Bresenham3D(x1, y1, z1, x2, y2, z2)
print(ListOfPoints)
main()
|
Javascript
function Bresenham3D(x1, y1, z1, x2, y2, z2) {
let ListOfPoints = [];
ListOfPoints.push([x1, y1, z1]);
let dx = Math.abs(x2 - x1);
let dy = Math.abs(y2 - y1);
let dz = Math.abs(z2 - z1);
let xs;
let ys;
let zs;
if (x2 > x1) {
xs = 1;
} else {
xs = -1;
}
if (y2 > y1) {
ys = 1;
} else {
ys = -1;
}
if (z2 > z1) {
zs = 1;
} else {
zs = -1;
}
if (dx >= dy && dx >= dz) {
let p1 = 2 * dy - dx;
let p2 = 2 * dz - dx;
while (x1 != x2) {
x1 += xs;
if (p1 >= 0) {
y1 += ys;
p1 -= 2 * dx;
}
if (p2 >= 0) {
z1 += zs;
p2 -= 2 * dx;
}
p1 += 2 * dy;
p2 += 2 * dz;
ListOfPoints.push([x1, y1, z1]);
}
} else if (dy >= dx && dy >= dz) {
let p1 = 2 * dx - dy;
let p2 = 2 * dz - dy;
while (y1 != y2) {
y1 += ys;
if (p1 >= 0) {
x1 += xs;
p1 -= 2 * dy;
}
if (p2 >= 0) {
z1 += zs;
p2 -= 2 * dy;
}
p1 += 2 * dx;
p2 += 2 * dz;
ListOfPoints.push([x1, y1, z1]);
}
} else {
let p1 = 2 * dy - dz;
let p2 = 2 * dx - dz;
while (z1 != z2) {
z1 += zs;
if (p1 >= 0) {
y1 += ys;
p1 -= 2 * dz;
}
if (p2 >= 0) {
x1 += xs;
p2 -= 2 * dz;
}
p1 += 2 * dy;
p2 += 2 * dx;
ListOfPoints.push([x1, y1, z1]);
}
}
return ListOfPoints;
}
function main() {
let x1 = -1;
let y1 = 1;
let z1 = 1;
let x2 = 5;
let y2 = 3;
let z2 = -1;
let ListOfPoints = Bresenham3D(x1, y1, z1, x2, y2, z2);
console.log(ListOfPoints);
}
main();
|
C#
using System;
using System.Collections.Generic;
namespace Bresenham3D
{
public class Program
{
public static List<List<int>> Bresenham3D(int x1, int y1, int z1, int x2, int y2, int z2)
{
List<List<int>> ListOfPoints = new List<List<int>>();
ListOfPoints.Add(new List<int> { x1, y1, z1 });
int dx = Math.Abs(x2 - x1);
int dy = Math.Abs(y2 - y1);
int dz = Math.Abs(z2 - z1);
int xs;
int ys;
int zs;
if (x2 > x1)
xs = 1;
else
xs = -1;
if (y2 > y1)
ys = 1;
else
ys = -1;
if (z2 > z1)
zs = 1;
else
zs = -1;
if (dx >= dy && dx >= dz)
{
int p1 = 2 * dy - dx;
int p2 = 2 * dz - dx;
while (x1 != x2)
{
x1 += xs;
if (p1 >= 0)
{
y1 += ys;
p1 -= 2 * dx;
}
if (p2 >= 0)
{
z1 += zs;
p2 -= 2 * dx;
}
p1 += 2 * dy;
p2 += 2 * dz;
ListOfPoints.Add(new List<int> { x1, y1, z1 });
}
}
else if (dy >= dx && dy >= dz)
{
int p1 = 2 * dx - dy;
int p2 = 2 * dz - dy;
while (y1 != y2)
{
y1 += ys;
if (p1 >= 0)
{
x1 += xs;
p1 -= 2 * dy;
}
if (p2 >= 0)
{
z1 += zs;
p2 -= 2 * dy;
}
p1 += 2 * dx;
p2 += 2 * dz;
ListOfPoints.Add(new List<int> { x1, y1, z1 });
}
}
else
{
int p1 = 2 * dy - dz;
int p2 = 2 * dx - dz;
while (z1 != z2)
{
z1 += zs;
if (p1 >= 0)
{
y1 += ys;
p1 -= 2 * dz;
}
if (p2 >= 0)
{
x1 += xs;
p2 -= 2 * dz;
}
p1 += 2 * dy;
p2 += 2 * dx;
ListOfPoints.Add(new List<int> { x1, y1, z1 });
}
}
return ListOfPoints;
}
public static void Main(string[] args)
{
int x1 = -1;
int y1 = 1;
int z1 = 1;
int x2 = 5;
int y2 = 3;
int z2 = -1;
List<List<int>> ListOfPoints
= Bresenham3D(x1, y1, z1, x2, y2, z2);
Console.WriteLine("The generated points are:");
foreach (var it in ListOfPoints)
Console.WriteLine($"{it[0]} {it[1]} {it[2]}");
}
}
}
|
Output:[(-1, 1, 1), (0, 1, 1), (1, 2, 0), (2, 2, 0), (3, 2, 0), (4, 3, -1), (5, 3, -1)]
Like Article
Suggest improvement
Share your thoughts in the comments
Please Login to comment...