Box plot in R using ggplot2
Last Updated :
13 Jun, 2023
In this article, we are going to create a Boxplot with various functionality in R programming language using the ggplot2 package.
For data distributions, you may require more information than central tendency values (median, mean, mode). To analyze data variability, you need to know how dispersed the data are. Well, a Box plot is a graph that illustrates the distribution of values in data. Box plots are commonly used to show the distribution of data in a standard way by presenting five summary values. The list below summarizes the minimum, Q1 (First Quartile), median, Q3 (Third Quartile), and maximum values. Summarizing these values can provide us with information about our outliers and their values.
In ggplot2, geom_boxplot() is used to create a boxplot.
Syntax: geom_boxplot( mapping = NULL, data = NULL, stat = “identity”, position = “identity”, …, outlier.colour = NULL, outlier.color = NULL, outlier.fill = NULL, outlier.shape = 19, outlier.size = 1.5, notch = FALSE,na.rm = FALSE, show.legend = FALSE, inherit.aes = FALSE)
The dataset in use: Crop_recommendation
Let us first create a regular boxplot, for that, we first have to import all the required libraries and datasets in use. Then simply put all the attributes to plot by in ggplot() function along with geom_boxplot.
Example:
R
library(ggplot2)
Dataset <- c(17, 32, 8, 53, 1,45,56,678,23,34)
Dataset
ds <- read.csv(
crop=ggplot(data=ds, mapping=aes(x=label, y=temperature))+geom_boxplot()
crop
|
Output:

Box plot in R using ggplot2
Adding mean value to the boxplot
Mean value can also be added to a boxplot, for that we have to specify the function we are using, within stat_summary(). This function is used to add new summary values and add these summary values to the plot. By using this function you don’t need to calculate the mean values before plotting.
Syntax:
stat_summary( fun, geom)
Example:
R
library(ggplot2)
ds <- read.csv(
ggplot(ds, aes(x = label, y = temperature, fill = label)) +
geom_boxplot() +
stat_summary(fun = "mean", geom = "point", shape = 8,
size = 2, color = "white")
|
Output:

Box plot in R using ggplot2
Change legend position of Boxplot:
Now let us discuss the legend position in Boxplot using theme() function. We can change the legend position to top or bottom, or you can remove the legend position in a boxplot. It is possible to customize plot components such as titles, labels, fonts, backgrounds, gridlines, and legends by using themes. Plots can be customized by using themes. You can modify the theme of a single plot using the theme() method or you can modify the active theme, which will affect all subsequent plots, by calling theme_update().
Syntax:
theme( line, rect, text, title, aspect.ratio, axis.title, axis.title.x, axis.title.x.top, axis.title.x.bottom, axis.title.y, axis.title.y.left, axis.title.y.right, axis.text, axis.text.x, axis.text.x.top, axis.text.x.bottom, axis.text.y, axis.text.y.left, ……, validate = TRUE)
On this function, if you set legend.position argument to either top or bottom the position will change.
Example:
R
library(ggplot2)
ggplot(ds, aes(x = label, y = temperature, fill = label)) +
geom_boxplot() +
theme(legend.position = "top")
|
Output:

Box plot in R using ggplot2
Horizontal Boxplot using ggplot2 in R
Boxplots can also be placed horizontally using coord_flip() function. This function just switches the x and y-axis.
Example:
R
library(ggplot2)
ggplot(ds, aes(x = label, y = temperature, fill = label)) +
geom_boxplot() +
coord_flip()
|
Output:

Box plot in R using ggplot2
Change box plot line colors
1) default
Use the command color=label to add color to the outline of the bars.
Syntax:
color=label
Example:
R
library(ggplot2)
ds <- read.csv(
crop2<-ggplot(ds, aes(x=label, y=temperature, color=label)) +
geom_boxplot()
crop2
|
Output:
Box plot in R using ggplot2
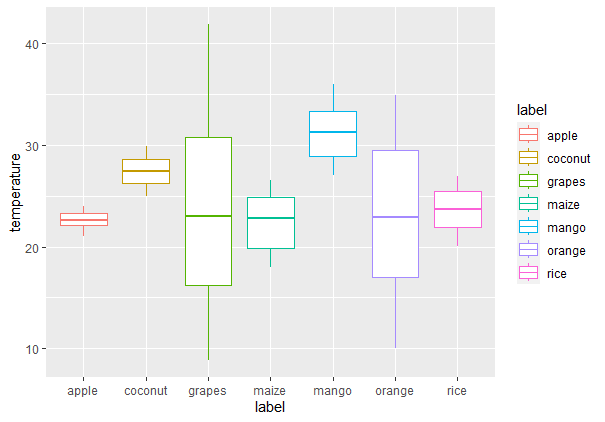
2) Manually
- Using custom color palettes: To use custom color palettes, use the scale_color_manual() function, and within this function provide outline color for each boxplot.
Example:
R
library(ggplot2)
crop2<-ggplot(ds, aes(x=label, y=temperature, color=label)) +
geom_boxplot()
crop2
crop2+scale_color_manual(values=c("#999999", "#E69F00",
"#56B4E9","#999999","Red",
"green","yellow"))
|
Output:
Box plot in R using ggplot2
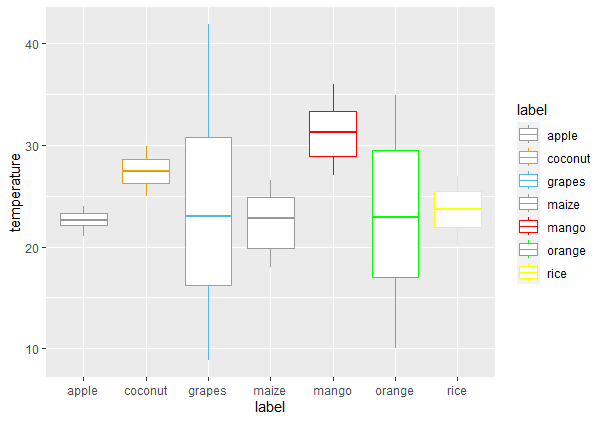
- Using brewer color palettes: You can change the outline color of the boxplot with brewer color palettes. For doing so you just need to use the scale_color_brewer() function and set the palette argument within this function.
Syntax:
scale_color_brewer(palette)
Example:
R
library(ggplot2)
ds <- read.csv(
crop2<-ggplot(ds, aes(x=label, y=temperature, color=label)) +
geom_boxplot()
crop2
crop2+scale_color_brewer(palette="Dark2")
|
Output:

Box plot in R using ggplot2
- Using grayscale: To use grayscale color palette you need to use scale_color_grey() function, and add theme_classic() function to it.
Example:
R
library(ggplot2)
crop2<-ggplot(ds, aes(x=label, y=temperature, color=label)) +
geom_boxplot()
crop2 + scale_color_grey() + theme_classic()
|
Output:

Box plot in R using ggplot2
Fill the boxplot with color
1) Default: For filling the boxplot with your choice of color then you can use the fill attribute command to add colors inside the geom_boxplot() function. The fill will be under geom_boxplot( ) as it is variable in this case.
Syntax:
fill=’color’
Example:
R
library(ggplot2)
crop1=ggplot(data=ds, mapping=aes(x=label, y=temperature))+
geom_boxplot(fill='green')
crop1
|
Output:

Box plot in R using ggplot2
For filling the boxplot color by default you just need to include fill attribute in aes() function within ggplot(). The fill will be inside aes( ) under ggplot( ) as it is variable in this case.
Syntax:
fill=label
Example:
R
library(ggplot2)
crop3<-ggplot(ds, aes(x = label, y = temperature, fill = label)) +
geom_boxplot(outlier.colour="black", outlier.shape=16, outlier.size=2)
crop3
|
Output:

Box plot in R using ggplot2
2) Manually: If you want to change boxplot colors manually then you can use three functions scale_fill_manual(), scale_fill_brewer() and scale_fill_grey() according to your choice.
- Using custom color palettes: To use custom color palettes scale_fill_manual() function is used and values of colors as an argument.
Syntax:
scale_fill_manual(values)
Example:
R
library(ggplot2)
ds <- read.csv(
crop3<-ggplot(ds, aes(x = label, y = temperature, fill = label)) +
geom_boxplot(outlier.colour="black", outlier.shape=16, outlier.size=2)
crop3+scale_fill_manual(values=c("#999999", "#E69F00", "#56B4E9",
"#999999","Red","green","yellow"))
|
Output:

Box plot in R using ggplot2
- Using brewer color palettes: To use brewer color palettes scale_fill_brewer() from RColorBrewer package and palette as an argument
Syntax:
scale_fill_brewer(palette)
Example:
R
library(ggplot2)
crop3<-ggplot(ds, aes(x = label, y = temperature, fill = label)) +
geom_boxplot(outlier.colour="black", outlier.shape=16, outlier.size=2)
crop3+scale_fill_brewer(palette="Dark1")
|
Output:
Box plot in R using ggplot2
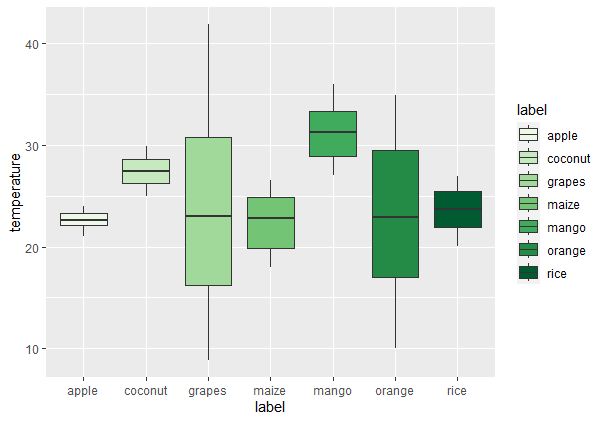
- Using grayscale: To fill color of boxplots with grayscale use scale_fill_grey() with theme_classic().
Example:
R
library(ggplot2)
crop3<-ggplot(ds, aes(x = label, y = temperature, fill = label)) +
geom_boxplot(outlier.colour="black", outlier.shape=16, outlier.size=2)
crop3 + scale_fill_grey() + theme_classic()
|
Output:

Box plot in R using ggplot2
Adding jitters in boxplots
Jitters are very useful to handle over-plotting problems caused by discrete datasets. You can also adjust the positions of the jitters too and for doing so you just need to set the position attribute within geom_jitter(). You can also change shape, size of a dot by using the size and shape argument in ggplot jitter.
Syntax:
geom_jitter(mapping = NULL, data = NULL, stat = “identity”, position = “jitter”, …, width = NULL, height = NULL, na.rm = FALSE, show.legend = NA, inherit.aes = TRUE)
Example:
R
library(ggplot2)
ggplot(ds, aes(x=label, y=temperature)) +
geom_boxplot()+
geom_jitter(position=position_jitter(0.2))
|
Output:
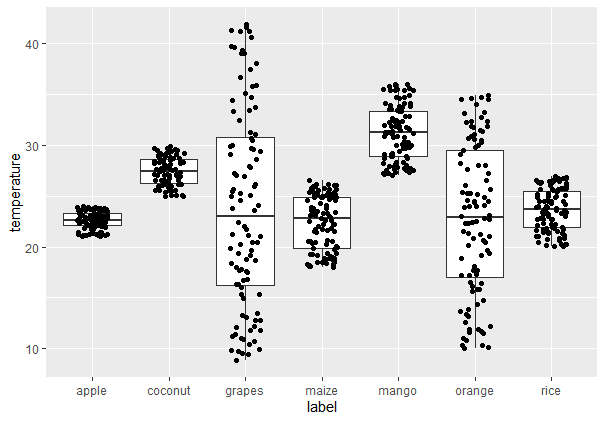
Box plot in R using ggplot2
Notched box plot
For adding notch boxplot you just need to set the notch attribute as TRUE within geom_boxplot().
Example:
R
library(ggplot2)
ggplot(ds, aes(x=label, y=temperature)) +
geom_boxplot(notch = TRUE)+
geom_jitter(position=position_jitter(0.2))
|
Output:

Box plot in R using ggplot2
Like Article
Suggest improvement
Share your thoughts in the comments
Please Login to comment...