Bokeh – Adding Widgets
Last Updated :
29 Jul, 2021
Bokeh is a Python data visualization library for creating interactive charts & plots. It helps us in making beautiful graphs from simple plots to dashboards. Using this library, we can create javascript-generated visualization without writing any scripts.
What is a widget?
Widgets are interactive controls that we can use with bokeh applications to make the interactive interface to visualizations. To use widgets, we can add them to the document & define their functions, or we can add them directly to the document root, added inside a layout. Two ways are allowed in bokeh to define methods for call back functionality:
- Use CustomJS callback for interactivity which works in HTML documents.
- Use bokeh server & setup event handlers with .on_change or .on_click.
These event handlers are user-defined functions in python that can be added to widgets and then called when certain actions are taken or attributes are changed in widgets. Before adding widgets to the visualization, we need to import some packages from bokeh library like:
- .io for showing the widgets & to make the output file.
- .layouts for widget box to wrap up all the widgets in it.
- .models.widgets base class for all type of interactive widgets.
And in the below example, we have used output_file() function to store the results into the file & show() to show the widgets in the browser.
Button
It is a clickable button widget that takes three parameters in constructors:
- label: String parameter used as text label or caption for the button to display.
- icon: Optional parameter used to appear image to the left of button’s caption.
- callback: Custom javascript functions to be called when certain changes occurred like button clicking.
Here we have used button_type to specify the color like primary(blue), warning(yellow), success(green), danger(red).
Python3
from bokeh.io import output_file, show
from bokeh.layouts import widgetbox
from bokeh.models.widgets import Button
output_file("button.html")
b1 = Button(label = "Back", button_type = "primary")
show(widgetbox(b1))
|
Output:
Dropdown menu
This is a list of options that each contains a menu vertically. When you click one of the options from it a list of options dropdown below the main menu.
It takes three parameters:
- label: The text which is to be displayed as the title of the menu.
- button_type: To specify the button type.
- menu: To specify the menu of the options available to choose.
Python3
from bokeh.io import output_file, show
from bokeh.layouts import widgetbox
from bokeh.models.widgets import Dropdown
output_file("dropdown_menu.html")
menu = [("Item 1", "item_1"), ("Item 2", "item_2"),
("Item 3", "item_3")]
dropdown_menu = Dropdown(label = "Dropdown button",
button_type = "warning",
menu = menu)
show(widgetbox(dropdown_menu))
|
Output:
Checkbox button group
Through this widget, we can select multiple options at once.
Two parameters are given here:
- labels: To specify the name of the options to be selected.
- active: To define which of the options to be selected at once(like 0 for first options,1 for second & so on).
Python3
from bokeh.io import output_file, show
from bokeh.layouts import widgetbox
from bokeh.models.widgets import CheckboxButtonGroup
output_file("checkbox_button.html")
cbg= CheckboxButtonGroup(
labels=["Apple", "Samsung", "Lenovo"], active=[0, 1])
show(widgetbox(cbg))
|
Output:
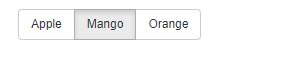
Radio button group
This widget allows selecting at most one button at a time.
Parameters:
- labels: To define name of the options.
- active: Here we can give only one value because in the radio button group only one button to select at a time.
Python3
from bokeh.io import output_file, show
from bokeh.layouts import widgetbox
from bokeh.models.widgets import RadioButtonGroup
output_file("radio_button.html")
radio_button = RadioButtonGroup(
labels = ["Apple", "Mango", "Orange"],
active = 0)
show(widgetbox(radio_button))
|
Output:
Select
It is a single selection widget which allows selecting a single value from a list of options.
The parameters used here are:
- title: To specify the title of the selection widget.
- value: Used to specify which value from the options to be selected.
- options: To specify the options to be available.
Python3
from bokeh.io import output_file, show
from bokeh.layouts import widgetbox
from bokeh.models.widgets import Select
output_file("single_select.html")
select = Select(title="Option:", value="Blue",
options=["Red", "Yellow", "Blue", "Green"])
show(widgetbox(select))
|
Output:
Slider
The slider has parameters like start or end value, step size, initial value, and a title.
- start: From which value the slider should start.
- end: The ending value where slider stops.
- value: In which value slider will stop.
- step: This parameter specifies the step value means the jump between the values.
- title: The title of the value in which slider stops.
Python3
from bokeh.io import output_file, show
from bokeh.layouts import widgetbox
from bokeh.models.widgets import Slider
output_file("slider.html")
slider = Slider(start = 0, end = 12,
value = 5, step = .1,
title = "Average")
show(widgetbox(slider))
|
Output:
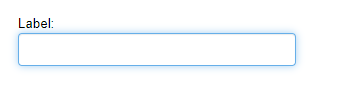
TextInput
This widget is used for collecting a line of text from the user.
- value: Initially what should be displayed before taking user input.
- title: Title of the TextInput widgets.
Python3
from bokeh.io import output_file, show
from bokeh.layouts import widgetbox
from bokeh.models.widgets import TextInput
output_file("text_input.html")
text = TextInput(value = "",
title = "Label:")
show(widgetbox(text))
|
Output:
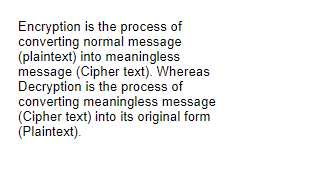
Paragraph
Used to display a block of text.
- text: Text which is to be displayed.
- width: height: To specify the width and height of the paragraph widget.
Python3
from bokeh.io import output_file, show
from bokeh.layouts import widgetbox
from bokeh.models.widgets import Paragraph
output_file("para.html")
para = Paragraph(text =
,
width = 250, height = 80)
show(widgetbox(para))
|
Output:
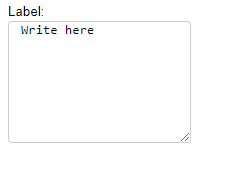
TextareaInput
This is used to store multiple lines of text from users.
- value: The default value of the Textarea widget.
- rows: Number of rows to be given as a space for text input.
- title: To specify the title of the Textarea widget.
Python3
from bokeh.io import show
from bokeh.models import TextAreaInput
text_area = TextAreaInput(value = "Write here",
rows = 6, title = "Label:")
show(text_area)
|
Output:
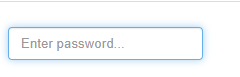
PasswordInput:
This hides the entered text input which is used for password input.
- placeholder: A short hint about the data which is to be entered in input area and when the user input value this will be removed.
Python3
from bokeh.io import show
from bokeh.models import PasswordInput
password = PasswordInput(placeholder = "Enter password...")
show(password)
|
Output:
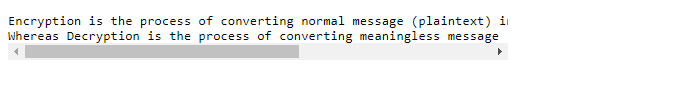
Pretext:
Used to display pre-formatted text.
- text: Text which is to be displayed.
- width, height: To specify the width and height of widget.
Python3
from bokeh.io import show
from bokeh.models import PreText
pretext = PreText(text=
,
width = 500, height = 120)
show(pretext)
|
Output:
RadioGroup:
It is a collection of radio boxes.
- labels: To specify the value of the options available to select.
- active: Default value which is shown as selected before choosing any option.
Python3
from bokeh.io import output_file, show
from bokeh.layouts import widgetbox
from bokeh.models.widgets import RadioGroup
output_file("radio_group.html")
radio_g = RadioGroup(
labels = ["AI", "ML", "Deep Learning"],
active = 1)
show(widgetbox(radio_g))
|
Output:

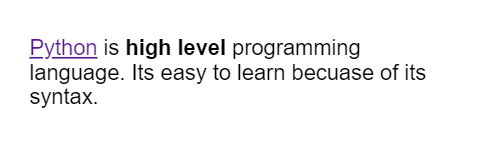
Div:
It is a small section or container in which various styling of that section can be done.
- text: Content which is to be displayed.
- width, height: To specify the width and height of this widget.
Python3
from bokeh.io import output_file, show
from bokeh.layouts import widgetbox
from bokeh.models.widgets import Div
output_file("div.html")
div = Div(text=
,
width = 250, height = 100)
show(widgetbox(div))
|
Output:
Toggle
Used to display the checked/unchecked state of the button or to change the setting between these two states.
- label: Text to be displayed as the title of the button.
- button_type: To specify the color of the button.
- width, height: To specify the width and height of the button.
Python3
from bokeh.io import output_file, show
from bokeh.models.widgets import Toggle
output_file("toggle.html")
toggle = Toggle(label = "Switch",
button_type = "success",
width = 250, height = 100)
show(toggle)
|
Output:
FileInput:
This allows the user to choose a file and store its information.
Python3
from bokeh.io import show
from bokeh.models.widgets import FileInput
file = FileInput()
show(file)
|
Output:
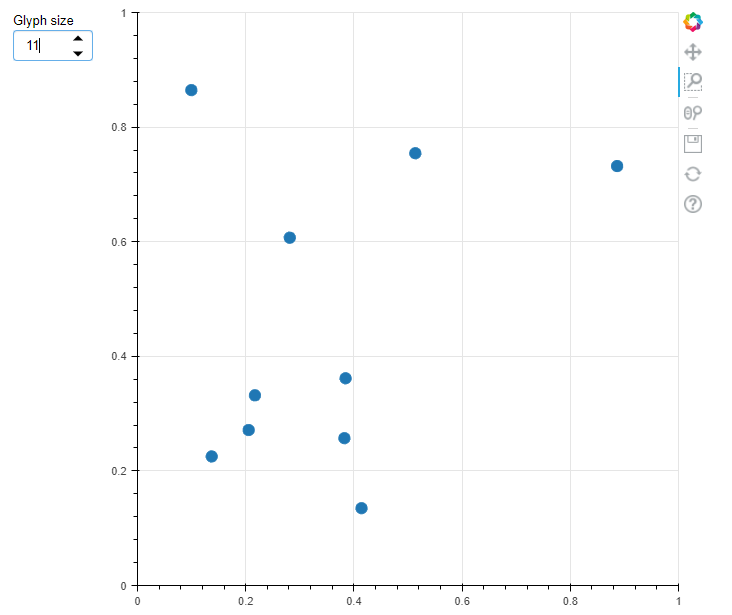
Spinner:
It provides a quick way to select one value from a set. In this widget, we have used different libraries like NumPy, etc.
- np.random.rand: To generate random numbers.
- figure: To make a figure for scatter plot.
In spinner constructor different parameters are given like:
- title: For giving title to spinner.
- low, high: To specify the lowest and highest possible value allowed for increasing the size of points in dropdown menu.
- step: This parameter specifies the step value means the jump between the values.
- value: Default value for menu.
- width: To define the width of the spinner.
And here we have linked two bokeh model properties using custom js callbacks(js_link) to update the properties of the model whenever certain actions are done.
Python3
import numpy as np
from bokeh.io import show
from bokeh.layouts import column, row
from bokeh.models import Spinner
from bokeh.plotting import figure
x = np.random.rand(10)
y = np.random.rand(10)
a = figure(x_range=(0, 1), y_range=(0, 1))
points = a.scatter(x = x, y = y, size = 4)
spinner = Spinner(title="Glyph size", low = 1,
high = 40, step = 0.5, value = 4, width = 80)
spinner.js_link('value', points.glyph, 'size')
show(row(column(spinner, width = 100), a))
|
Output:
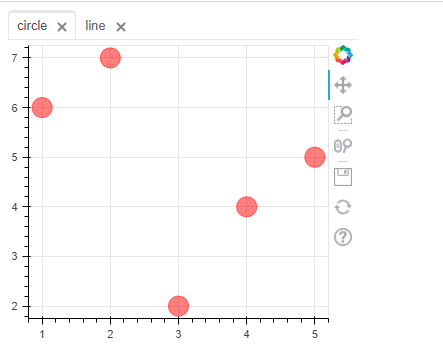
Tabs:
This widget allows multiple plots to be displayed in configurable panels. The layout of this widget consists of two bokeh models i.e. Tab() and Panel().
Here we have used figure() to make a figure for plotting and Panel() which is a container having title and control.
- circle(): To make circle plot.
- line(): To make a line plot.
Python3
from bokeh.io import show
from bokeh.models import Panel, Tabs
from bokeh.plotting import figure
p1 = figure(plot_width=350, plot_height=300)
p1.circle([1, 2, 3, 4, 5], [6, 7, 2, 4, 5],
size = 20, color = "red", alpha = 0.5)
tab1 = Panel(child=p1, closable = True,
title = "circle")
p2 = figure(plot_width = 350, plot_height = 300)
p2.line([1, 2, 3, 4, 5], [6, 7, 2, 4, 5],
line_width = 3, color = "blue", alpha = 0.5)
tab2 = Panel(child = p2, closable = True, title = "line")
show(Tabs(tabs = [tab1, tab2]))
|
Output:
DateRangeSlider:
It is used to select the date range with a slider.
Parameters used are:
- value: The default date range value which is to be displayed.
- start: To specify the starting value from where the slider should start.
- end: To specify the ending value from where the slider should stop.
Python3
from datetime import date
from bokeh.io import show
from bokeh.models import CustomJS, DateRangeSlider
date_range= DateRangeSlider(value = (date(2020, 1, 9),
date(2021, 1, 10)),
start = date(2019, 8, 12),
end = date(2021, 6, 9))
show(date_range)
|
Output:
DatePicker:
It is a calendar-based date selection widget.
- title: Text which is to be shown as the title of the widget.
- value: Default value to be displayed when options are not selected.
- min_date: Minimum date means from which month & date the calendar will start.
- max_date: Maximum date means from which month & date the calendar will be ended.
Python3
from bokeh.io import show
from bokeh.models import CustomJS, DatePicker
dp = DatePicker(title = 'Select date', value = "2021-06-09",
min_date = "2020-10-01", max_date = "2021-12-31")
show(dp)
|
Output:
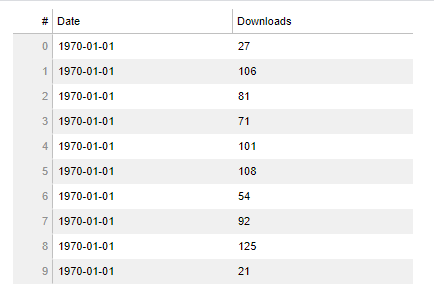
DataTable:
It is based on a slick grid which takes external components as data sources. And any plots which contain this data will automatically be linked with the plots and table.
Here we have made a dictionary for columns value and then mapped the list of data which is in form of a dictionary with a column using ColumnDataSource() function after that we make the layout of the column using TableColumn() having arguments as-
- field: Column contains what values.
- title: Title of column.
- formatter: To make the format of date column as date.
DataTable constructor contains:
- source: To define the mapped data with column as source.
- Column: To specify the column values.
- width, height: To define the width, height of the table.
Python3
from datetime import date
from random import randint
from bokeh.io import show
from bokeh.models import ColumnDataSource, DataTable, DateFormatter, TableColumn
data = dict(
dates=[date(2021, 5, i+1) for i in range(10)],
downloads=[randint(0, 130) for i in range(10)],
)
source = ColumnDataSource(data)
columns = [
TableColumn(field = "dates", title = "Date",
formatter = DateFormatter()),
TableColumn(field = "downloads", title = "Downloads"),
]
data_table = DataTable(source = source, columns = columns,
width = 400, height = 280)
show(data_table)
|
Output:
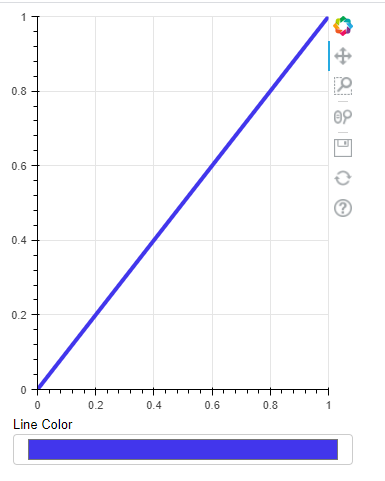
ColorPicker:
This provides the user to select RGB color value.
- Figure: To make a figure for plotting.
- plot.line: Used to make a line plot.
Python3
from bokeh.io import show
from bokeh.layouts import column
from bokeh.models import ColorPicker
from bokeh.plotting import Figure
plot = Figure(x_range=(0, 1), y_range=(0, 1),
plot_width=350, plot_height=400)
line = plot.line(x=(0,1), y=(0,1), color="green",
line_width=4)
picker = ColorPicker(title="Line Color")
picker.js_link('color', line.glyph, 'line_color')
show(column(plot, picker))
|
Output:
Like Article
Suggest improvement
Share your thoughts in the comments
Please Login to comment...