Bernoulli Distribution in R
Last Updated :
01 Aug, 2023
Bernoulli Distribution is a special case of Binomial distribution where only a single trial is performed. It is a discrete probability distribution for a Bernoulli trial (a trial that has only two outcomes i.e. either success or failure). For example, In R it can be represented as a coin toss where the probability of getting the head is 0.5 and getting a tail is 0.5. It is a probability distribution of a random variable that takes value 1 with probability p and the value 0 with probability q=1-p. The Bernoulli distribution is a special case of the binomial distribution with n=1.
The probability mass function f of this distribution, over possible outcomes k, is given by :

The above relation can also be expressed as:

In R Programming Language, there are 4 built-in functions to for Bernoulli distribution and all of them are discussed below.
dbern()
dbern( ) function in R programming measures the density function of the Bernoulli distribution.
Syntax: dbern(x, prob, log = FALSE)
Parameter:
- x: vector of quantiles
- prob: probability of success on each trial
- log: logical; if TRUE, probabilities p are given as log(p)
In statistics, it is given by below formula:
Example:
R
library(Rlab)
x <- c(0, 1, 3, 5, 7, 10)
y <- dbern(x, prob = 0.5)
plot(x, y, type = "o")
|
Output:

Bernoulli Distribution in R
pbern()
pbern( ) function in R programming giver the distribution function for the Bernoulli distribution. The distribution function or cumulative distribution function (CDF) or cumulative frequency function, describes the probability that a variate X takes on a value less than or equal to a number x.
Syntax: pbern(q, prob, lower.tail = TRUE, log.p = FALSE)
Parameter:
- q: vector of quantiles
- prob: probability of success on each trial
- lowe.tail: logical
- log.p: logical; if TRUE, probabilities p are given as log(p).
Example:
R
library(Rlab)
x <- seq(0, 10, by = 1)
y <- pbern(x, prob = 0.7)
plot(y, type = "o")
|
Output:

Bernoulli Distribution in R
The above plot represents the Cumulative Distribution Function of Bernoulli Distribution in R.
qbern()
qbern( ) gives the quantile function for the Bernoulli distribution. A quantile function in statistical terms specifies the value of the random variable such that the probability of the variable being less than or equal to that value equals the given probability.
Syntax: qbern(p, prob, lower.tail = TRUE, log.p = FALSE)
Parameter:
- p: vector of probabilities.
- prob: probability of success on each trial.
- lower.tail: logical
- log.p: logical; if TRUE, probabilities p are given as log(p).
Example:
R
library(Rlab)
x <- seq(0, 1, by = 0.2)
y <- qbern(x, prob = 0.5,lower.tail = TRUE, log.p = FALSE)
plot(y, type = "o")
|
Output:

Bernoulli Distribution in R
rbern()
rbern( ) function in R programming is used to generate a vector of random numbers which are Bernoulli distributed.
Syntax: rbern(n, prob)
Parameter:
- n: number of observations.
- prob: number of observations.
Example:
R
library(Rlab)
set.seed(9999)
N <- 100
random_values <- rbern(N, prob = 0.5)
print(random_values)
hist(random_values,breaks = 10,main = "")
|
Output:
  [1] 0 0 0 1 0 1 1 0 0 1 0 1 1 1 0 0 0 0 1 0 1 0 1 0 0 0 0 1 1 0 0 0 0 1 0 0 0 0 1 0
 [41] 1 0 1 0 1 1 0 1 1 0 0 0 0 0 1 0 1 0 0 1 0 1 0 0 0 1 0 1 0 0 0 1 0 0 1 1 0 1 1 0
 [81] 1 0 0 0 1 0 0 1 1 0 1 1 0 1 1 1 1 1 0 1
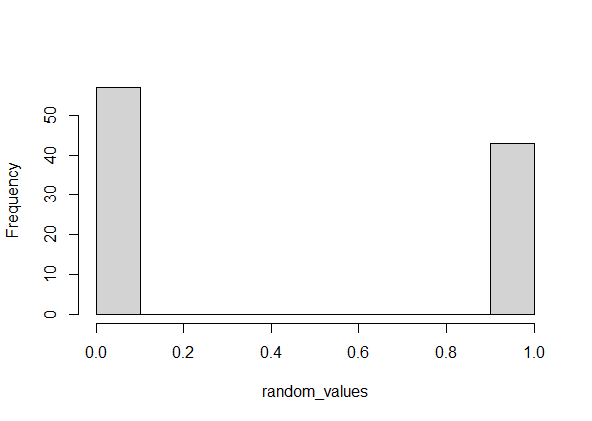
Bernoulli Distribution in R
The above plot represents Randomly Drawn Numbers of Bernoulli Distribution in R.
Applications of Bernoulli Distribution:
- The Bernoulli distribution is frequently used in machine learning and data analysis for binary classification tasks. It can simulate the likelihood that a sample will fall into a specific class or category.
- The Bernoulli distribution is used to model click-through rates (CTR) in online advertising and marketing. The distribution can be used to calculate the likelihood that a user will click on an advertisement or perform a particular activity.
- To ascertain if a product or procedure complies with specific criteria, the Bernoulli distribution is used in quality control. It is possible to utilize it to simulate the occurrence of flaws or failures.
- When analyzing survey data, binary replies to questions with true/false or yes/no alternatives can be modeled using the Bernoulli distribution. This makes it possible to estimate response probabilities and compare proportions.
- Clinical trials and epidemiological research are two examples of biological investigations that make use of the Bernoulli distribution. It can simulate things like the onset of an illness, the efficacy or inefficacy of treatments, or patient reactions.
- In reliability engineering, binary events linked to system dependability, such as component failure or system downtime, can be analyzed using the Bernoulli distribution.
- The Bernoulli distribution is used to represent the probability of uncommon events or insurance claims in risk assessment and insurance studies.
Like Article
Suggest improvement
Share your thoughts in the comments
Please Login to comment...