Basic Cartogram with R
Last Updated :
22 Feb, 2022
A cartogram is a map in which the geometry of regions is distorted in order to convey the information of an alternate variable. In this post, we are going to draw a map of Africa where the size of each country is distorted proportionally to its population. A cartogram is frequently a choropleth map in which regions are colored according to a numeric value (not necessarily the one used to build the cartogram). To understand the cartogram more easily, one can refer to what a geospatial object is.
Preparing the Map data and creating Basic Cartogram
To perform a cartogram map we will create map data using wrld_simpl.
R
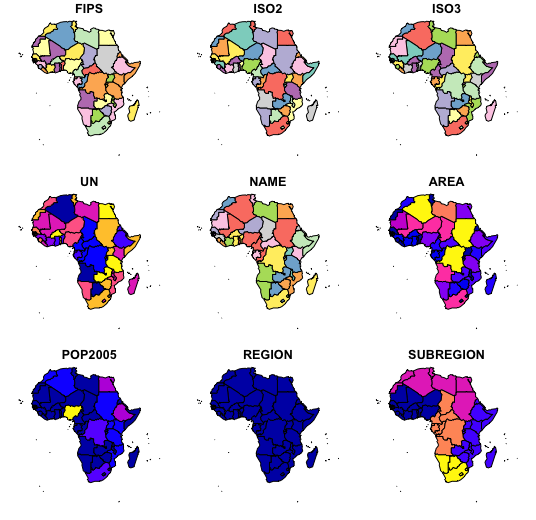
library(maptools)
data(wrld_simpl)
afr = wrld_simpl[wrld_simpl$REGION==2,]
plot(afr)
|
Output:
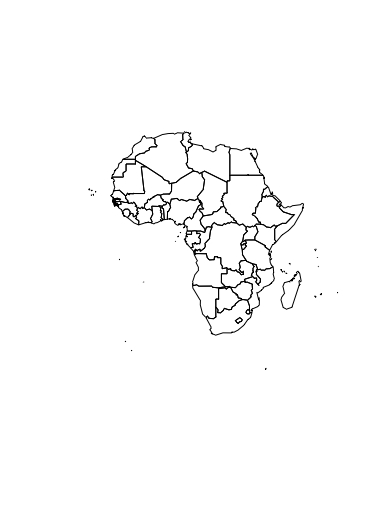
Spatial Polygon Features in Cartogram
We have a spatial object and a numeric value associated with each region, it is possible to color each region according to its value.
R
library(sf)
afr_sf = st_as_sf(afr)
plot(afr_sf)
|
Output:
Cartogram and its customization
Here we will create cartogram and then we will customize for this we will use wrld_simpl and then extract the information like shape, coordinates and then transform geometry polygon objects to new geospatial objects.
R
library(tidyverse)
library(maptools)
data(wrld_simpl)
afr_data = wrld_simpl[wrld_simpl$REGION == 2,]
cat ("Type of afr_data: ", typeof(afr_data), "\n\n")
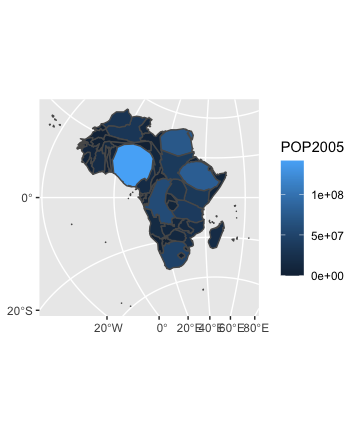
library(cartogram)
sfno = st_as_sf(afr)
sfnoproj = st_transform(sfno, crs = 23038)
afr_cartogram <- cartogram_cont(sfnoproj, "POP2005", itermax = 7)
ggplot() +
geom_sf(data = afr_cartogram, aes(fill = POP2005))
|
Output:
Type of afr_data:  S4
Mean size error for iteration 1: 6.65362274402649
Mean size error for iteration 2: 5.77932593731838
Mean size error for iteration 3: 5.11349284302375
Mean size error for iteration 4: 4.56333360251358
Mean size error for iteration 5: 4.09786807153034
Mean size error for iteration 6: 3.69769020137334
Mean size error for iteration 7: 3.3519304681889
Like Article
Suggest improvement
Share your thoughts in the comments
Please Login to comment...