Bar Graphs and Histograms
Last Updated :
15 Apr, 2024
Bar graphs and Histograms: The science of collecting and analyzing data in large quantities, especially for inferring proportions in a whole form is known as Statistics. The word ‘statistics’ itself refers to numbers that are used to describe the relationships of data. Therefore, we can say that the field of applied mathematics that deals with data collection, organization, analysis, interpretation, and presentation is called statistics.
A Bar graph or a Histogram is the diagrammatic representation of data in statistics. In bar graphs or histograms, using graphs, charts, and tabular data makes it very easy to understand the concepts and relationships among data.
In this article, we have provided everything about Bar Graph and Histograms along with their properties, significance, and examples of Bar Graphs and Histograms.
What is a Bar Graph?
The pictorial representation of data in groups, either in horizontal or vertical bars where the length of the bar represents the value of the data present on the axis. They (bar graphs) are usually used to display or impart the information belonging to ‘categorical data’ i.e.; data that fit in some category.
Reading a Bar Graph and comparing two sets of data
To read a Bar graph, we need to ask questions to ourselves looking at the displayed graph. Let’s understand reading a Bar graph through a fundamental example,
Different types of fruits are liked by People,
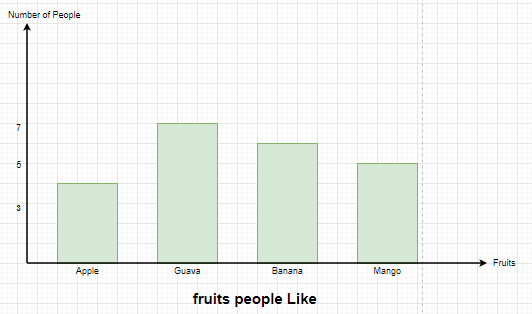
What does the X-axis and Y-axis on the graph are representing?
The X-axis represents the different types of fruits like apple, guava. while Y-axis represents the Number of people.
What is the Common base for the Bars?
The bars are showing a common base of category of fruits.
What is the scale used on the Y-axis?
The scale used is normal, i.e; 1 Unit = 1 person
Overall, what kind of information the bar graph displaying?
The bar graph is displaying the number of People liking different types of fruits.
Looking at the bar Graph, can one answer, how many people like Mango?
Yes, By observing the length of the bar, one can tell that there are 5 people who like Mango.
Comparing two sets of data
Noticing the graph, explain the fruit liked by most people and the fruit liked by least people?
The data displayed on the graph is easily comparable, it can be concluded that the most liked fruit is Guava and the least liked fruit is Apple.
How many more people like Guava than Mango?
There are 7 people who like guava and 5 who like Mango. Thus, we can say that there are 2 more people liking guava.
It can be concluded the following just by looking at the graph:
- 4 People like Apples.
- 7 People like guava.
- 6 People like banana.
- 5 People like Mango.
Properties of Bar Graph
- All Bars have a common base.
- The length of each bar corresponds to its respective data mentioned on the axis (Y-axis for Vertical Graph, X-axis for Horizontal Graph).
- Each bar displayed has the same width.
- The distance between consecutive bars is the same
Significance of a Bar Graph
It is always easier and more comfortable to visually understand something than to look at the large table of Numerical data. Bar graphs are extensively used in presentations and reports. It is very prominently used as it summarizes data and displays it in a frequency distribution.
Bar Graph Examples
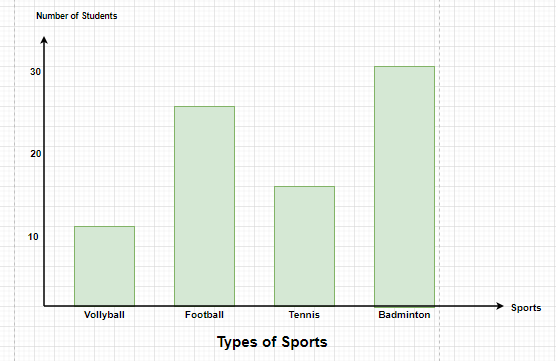
Question 1: Draw the Bar Graph for the following table,
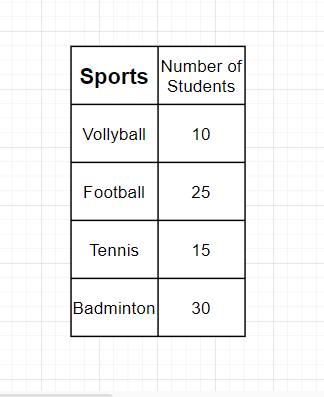
Solution:
The Bar Graph for the following table is,
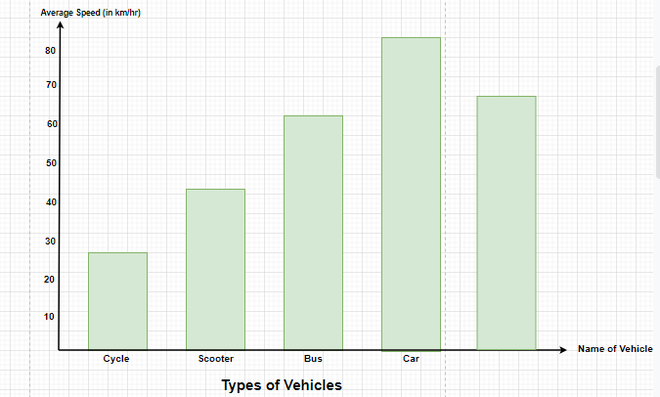
Question 2: The average speed of some vehicles is shown below, Represent it through a bar graph.
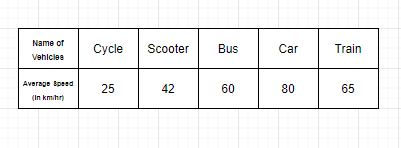
Solution:
The average speed mentioned in the table is the frequency that decides the length of each bar graph, therefore, if the graph is vertical, the Average speed will be shown on the y-axis and the types of vehicles will be shown on the x-axis.
What is a Histogram?
Histograms are the graphical display of data with the help of bars, the heights of the bars may vary due to different data. The similarity of a Histogram resembles a bar chart, but histogram groups numbers into different ranges. The length of each bar tells how many fall into each range, and it can be decided which ranges are to be used.
Construction and interpretation of Histogram
- First, mark the class intervals on X-axis and frequencies on Y-axis.
- Make sure that the scale of both axes is the same.
- The class Intervals shall always be exclusive.
- Create bars with class intervals on the x-axis and corresponding frequencies on the y-axis.
- The length of each bar reflects the Frequency when intervals are equal.
- The area of each bar is the same as its respective frequency when intervals are unequal.
Difference Between Bar Graphs and Histograms
- Bar graph is a one-dimensional figure while Histogram is a two-dimensional figure.
- In Bar graphs, the length of the bars shows the frequency, but the width has no special significance but in Histograms, the frequency is shown by the area of the bar.
- In bar graphs, the bars are separated from each other with equal spaces, while in Histograms, the bars are always touching each other.
Histogram Examples
Question 1: In a Park, there are 28 trees of different heights, the heights can be measured in centimeters and the range of the trees lie between 100-350 cms. Draw the Histogram for the following data,
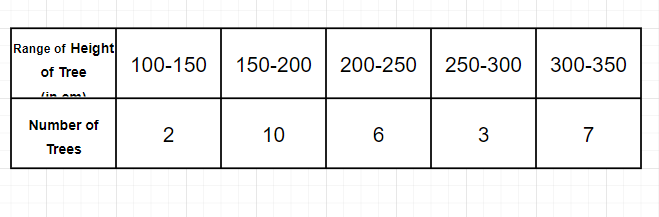
Solution:
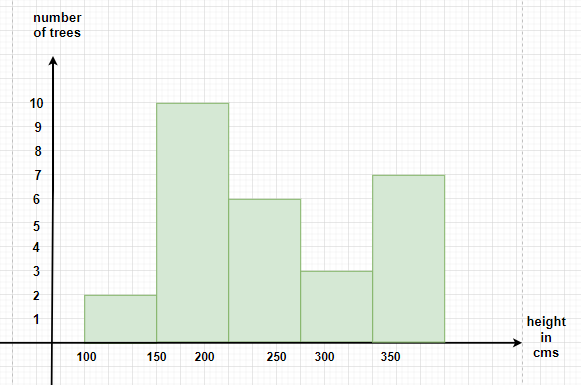
Since the height of the trees are lying between 100-350, we shall start by marking the heights on x-axis in groups of 50cm each and the number of trees will be mentioned on y-axis.
Therefore, if a tree has a height of 230 cm, it will lie in the rectangle 200-250.
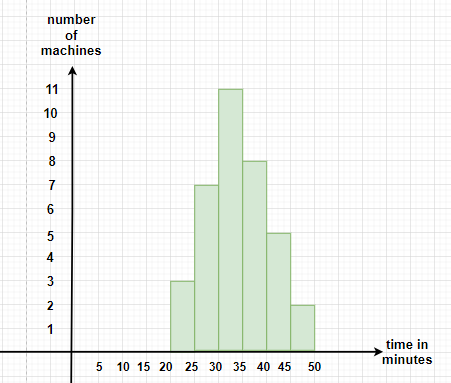
Question 2: In the below-given table, the number of machines working in a factory for their fixed amount of time is shown. Draw the Histogram for the following data.
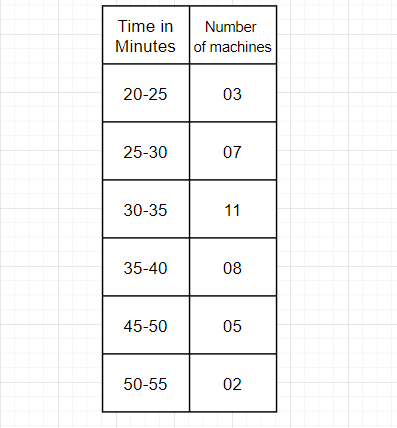
Solution:
The Histogram for the table mentioned above will have class intervals of 5 minutes on x-axis and the number of machines used should be on y-axis
FAQs on Bar Graphs and Histograms
What is difference between histogram and bar graph?
- A histogram is used to represent the distribution of numerical data by dividing the data into bins or intervals and counting the frequency of observations within each bin. It helps to show patterns such as the spread and central tendency of the data. Histograms are typically used for continuous data where the bins represent ranges of data.
- A bar graph is used to display categorical data with rectangular bars where each bar represents a category and the height or length of the bar corresponds to the value or frequency of that category. Bar graphs are useful for comparing different groups or categories.
What is the difference between a line graph and a histogram?
- A line graph displays information as a series of data points called ‘markers’ connected by straight line segments. It is primarily used to show trends over time (i.e., changes in data across evenly spaced intervals).
- A histogram, as mentioned earlier, is used to represent the distribution of numerical data and does not necessarily track changes over time. It groups data into intervals, showing frequency counts within those intervals.
What are bar graphs used for?
Bar graphs are used to compare amounts across different categories. They make it easy to compare the sizes of different groups and to see which categories are larger or smaller. They are often used in business for comparing items like sales, costs, or quantities across different products, regions, or periods.
What is histogram graph?
A histogram is a graphical representation of the distribution of numerical data. It is an estimate of the probability distribution of a continuous variable and was first introduced by Karl Pearson. To construct a histogram, the first step is to “bin” (or “bucket”) the range of values—that is, divide the entire range of values into a series of intervals—and then count how many values fall into each interval. The intervals are typically of equal size, and the frequency of the data that falls into each interval is depicted by the height of a bar
Like Article
Suggest improvement
Share your thoughts in the comments
Please Login to comment...