Annotate Text Outside of ggplot2 Plot in R
Last Updated :
03 Mar, 2021
Ggplot2 is based on the grammar of graphics, the idea that you can build every graph from the same few components: a data set, a set of geoms—visual marks that represent data points, and a coordinate system. There are many scenarios where we need to annotate outside the plot area or specific area as per client requirements. In this case, the ggplot2 library comes very handy with its sub-options to get the required output and with good customization options for data visualizations.
To add annotations in R using ggplot2, annotate() function is used.
Syntax: annotate()
Parameters:
- geom : specify text
- x : x axis location
- y : y axis location
- label : custom textual content
- color : color of textual content
- size : size of text
- fontface : fontface of text
- angle : angle of text
Approach
- Import library
- Create or load dataset
- Create a normal plot
- Add annotate() function with required parameters
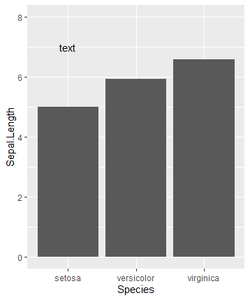
Let us first see how annotations are added inside the plot, so that the difference in position of the annotations can be understood better.
Examples :
R
library(ggplot2)
Dt = iris
ggplot(Dt,aes(x=Species,y=Sepal.Length)) +
geom_bar(stat = "summary", fun = "mean") +
annotate("text", x = 1, y = 7, label = "Arbitrary text") +
coord_cartesian(ylim = c(0, 8), clip = "off")
|
Output:
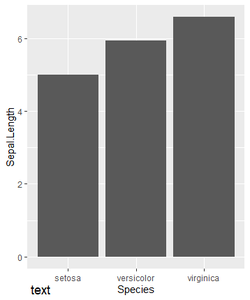
Now let us visualize with annotations outside the plot.
Example:
R
library(ggplot2)
Dt = iris
ggplot(Dt,aes(x=Species,y=Sepal.Length)) +
geom_bar(stat = "summary", fun = "mean") +
annotate("text", x = 1, y = -1, label = "text") +
coord_cartesian(ylim = c(0, 8), clip = "off")
|
Output:
Like Article
Suggest improvement
Share your thoughts in the comments
Please Login to comment...