Alpha and Beta test
Last Updated :
26 Nov, 2020
In the previous article, we discussed hypothesis testing which is the backbone of inferential statistics. We previously discussed the basic hypothesis testing including Null and Alternate Hypothesis, z-test, etc. Now, in this discussed more Type I and Type II error, level of significance (alpha), and Power(beta).
P-value:
The p-value is defined as the probability of obtaining a result or more extreme than what was actually observed in the normal distribution. Generally, we take the level of significance=0.05, it means if the observed p-value is less than the level -of-significance then, we reject the null hypothesis.
To calculate the p-value, we need the table particular test statistics (t-test, z-test, f-test) and whether it is a one-tailed, two-tailed test.
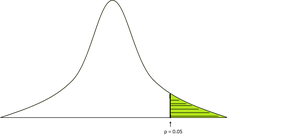
p-value
Alpha and Beta Test:
| | Null Hypothesis is TRUE | Null Hypothesis is FALSE |
|---|
| Reject Null Hypothesis |
Type I Error
 |
Correct decision
 |
|---|
| Fail to Reject the Null Hypothesis |
Correct decision
 |
Type II error
 |
|---|
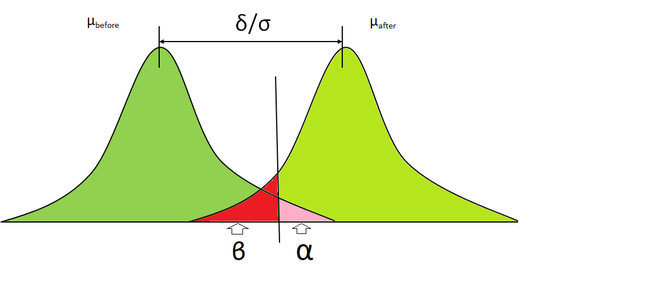
- Type I Error (Alpha): Now, if we reject the null hypothesis based on the level of significance p-value calculations, there is a possibility that the samples, in reality, belong to the same (null) distribution, and we incorrectly rejected it, this is called Type I error and it is denoted by alpha
- Type II Error (Beta): Now, on the basis of the level of significance and p-value, if we accept a sample that does not really belong to the same distribution then, it is referred to as Type II error
Power and Confidence Interval:
- Confidence Interval: The confidence interval is the region in which is we can confidently reject the null hypothesis. It is calculated by subtracting alpha and 1

- Power: Power is the probability of correctly rejecting the null hypothesis and accepting the Alternative Hypothesis (HA). Power can be calculated by subtracting beta from 1.

The higher the power makes lower the probability of making a Type II error. Lower power means a higher risk of performing a Type II error and vice-versa. Generally, 0.80 power is considered good enough. Power is also dependent on the following factors:
- Effect size: Effect size is simply the way of measuring the strength of the relationship between two variables. There are many ways of calculating effect sizes such as Pearson correlations for calculating correlations between two variables, Cohen’s d test for measuring the difference between groups, or simply by calculating the difference between means of different groups.
- Sample Size: The number of observations that are included in the statistical sample.
- Significance: Level of significance used in the test (alpha).
Steps to Perform Power Analysis
- State the Null Hypothesis (H0) and Alternative Hypothesis (HA).
- State the alpha risk level (level of significance).
- Choose the appropriate statistical test.
- Decide the Effect size.
- Create sampling plans and determine the sample size. After that gather the sample.
- Calculate the test statistic by determining the p-value.
- If p-value < alpha, then we reject the null hypothesis.
- Repeat the above steps a few times.
Examples
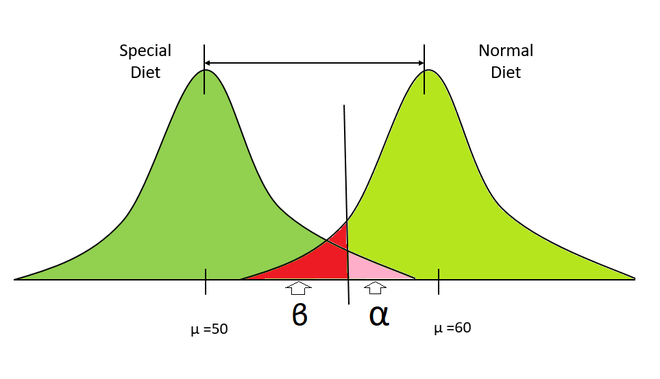
Special diet distribution vs Normal diet distribution
- Suppose there is two distribution representing the weights of two groups of people, the left representing people on diet and right representing people who take normal food.
- We take some samples from both the distribution and calculate their means.
- Here, our null hypothesis will be both samples are from the same distribution (no effect of diet plan) and the alternate hypothesis will be that both samples are from a different distribution.
- Now, we calculate the p-value from these samples.
- If our p-value is smaller than the level of significance then we correctly reject the null hypothesis that both these samples are from the same distribution.
- else, we don’t reject the null hypothesis.
- Now, we repeat the above steps numerous times (i.e 1000, 10000), etc. and we calculate the probability of correctly rejecting the null hypothesis i.e. Power.
Implementation:
Python3
import numpy as np
from statsmodels.stats.power import TTestIndPower
import matplotlib.pyplot as plt
effect_size = (60-50)/10
alpha = 0.05
samples =20
p_analysis = TTestIndPower()
power = p_analysis.solve_power(effect_size=effect_size, alpha=alpha, nobs1 = samples, ratio =1)
print("Power is ",power)
|
0.8689530131730794
Like Article
Suggest improvement
Share your thoughts in the comments
Please Login to comment...