Aggregate Daily Data to Month and Year Intervals in R DataFrame
Last Updated :
23 Sep, 2021
In this article, we are going to see how to aggregate daily data over a period of months and year intervals in dataframe in R Programming Language.
Method 1 : Using aggregate() method
Base R contains a large number of methods to perform operations on the dataframe. The seq() method in R is used to generate regular sequences beginning from a pre-defined value.
Syntax: seq(from , to , by , length.out)
Arguments :
- from – The value from where to begin the sequence. The as.Date() method is used here, in order to generate a sequence of dates until the length of the sequence is met.
- to – The value where to end the sequence.
- by – The parameter to increment the sequence. “day” is used as a parameter here, in order to generate successive dates in order.
- length.out – The total length of the sequence.
The dataframe is then formed using a sample from this date sequence generated as column 1. The value is generated using the rnorm() method to produce random floating-point numbers.
The strftime() method is then used to convert a time object to a character string back. The format can be specified to extract different components of the date object.
Syntax: strftime (date, format)
Arguments :
- date – The object to be converted
- format – We use %m to extract the month and %Y to extract the year in YYYY format.
In order to aggregate the data, the aggregate method is used, which is used to compute summary statistics of each of the groups.
Syntax: aggregate ( formula , data , FUN)
Arguments :
- formula – a formula, such as y ~ x
- data – The dataframe over which to apply the function
- FUN – The function to be applied to the dataframe. Here, the function applied is sum in order to perform the aggregation or summation over the values belonging to same group.
Code:
R
set.seed(99923)
len <- 100
var_seq <- seq(as.Date("2021/05/01"),
by = "day",
length.out = len)
data_frame <- data.frame(col1 = sample( var_seq,
100, replace = TRUE),
col2 = round(rnorm(10, 5, 2), 2))
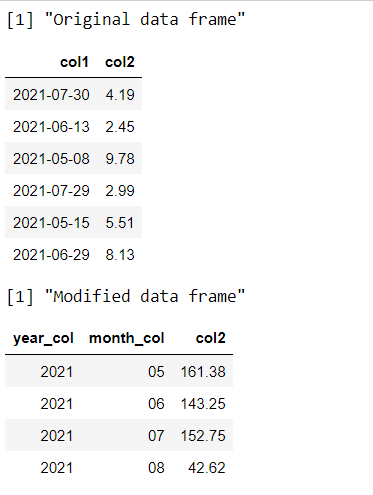
print("Original dataframe")
head(data_frame)
data_frame$year_col <- strftime(data_frame$col1, "%Y")
data_frame$month_col <- strftime(data_frame$col1, "%m")
data_frame_mod <- aggregate(col2 ~ year_col + month_col,
data_frame,
FUN = sum)
print("Modified dataframe")
head(data_frame_mod)
|
Output:
Method 2: Using lubridate and dplyr package
Lubridate package in R is used to provide easier working mechanisms with the date and time objects. It can be loaded and installed in the working space using the following command :
install.packages("lubridate")
The floor_date() method in R uses a date-time object, may be a single entity or vector of date-time objects, and then further rounds it off to the nearest integer value in the specified unit of time.
floor_date(x , unit = months)
The dplyr package is used to perform data manipulations and statistics. It can be loaded and installed in the working space using the following command :
install.packages("dplyr")
The dataframe is modified by using the piping operator over a sequence of operations and methods. The group_by() method is used to group the data based on the values contained in the specified columns.
group_by(col1,..)
Then a summary statistic is performed using the summarize() method which performs a summation over the values contained in the third column. The result is then manipulated into a dataframe using the as.data.frame() method.
Code:
R
library("dplyr")
library("lubridate")
set.seed(99923)
len <- 100
var_seq <- seq(as.Date("2021/05/01"),
by = "day",
length.out = len)
data_frame <- data.frame(col1 = sample( var_seq,
100, replace = TRUE),
col2 = round(rnorm(10, 5, 2), 2))
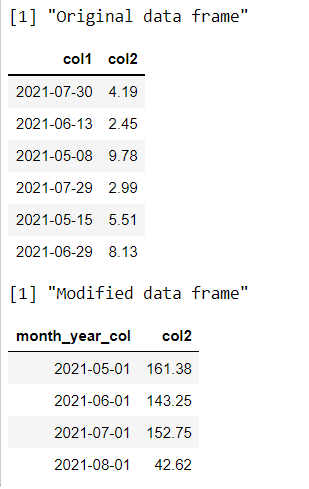
print("Original dataframe")
head(data_frame)
data_frame$month_year_col <- floor_date(data_frame$col1,
"month")
data_frame_mod <- data_frame %>%
group_by(month_year_col) %>%
dplyr::summarize(col2 = sum(col2)) %>%
as.data.frame()
print("Modified dataframe")
head(data_frame_mod)
|
Output:
Like Article
Suggest improvement
Share your thoughts in the comments
Please Login to comment...