Adding Straight Lines to a Plot in R Programming – abline() Function
Last Updated :
14 Jul, 2020
abline() function in R Language is used to add one or more straight lines to a graph. The abline() function can be used to add vertical, horizontal or regression lines to plot.
Syntax:
abline(a=NULL, b=NULL, h=NULL, v=NULL, …)
Parameters:
a, b: It specifies the intercept and the slope of the line
h: specifies y-value for horizontal line(s)
v: specifies x-value(s) for vertical line(s)
Returns: a straight line in the plot
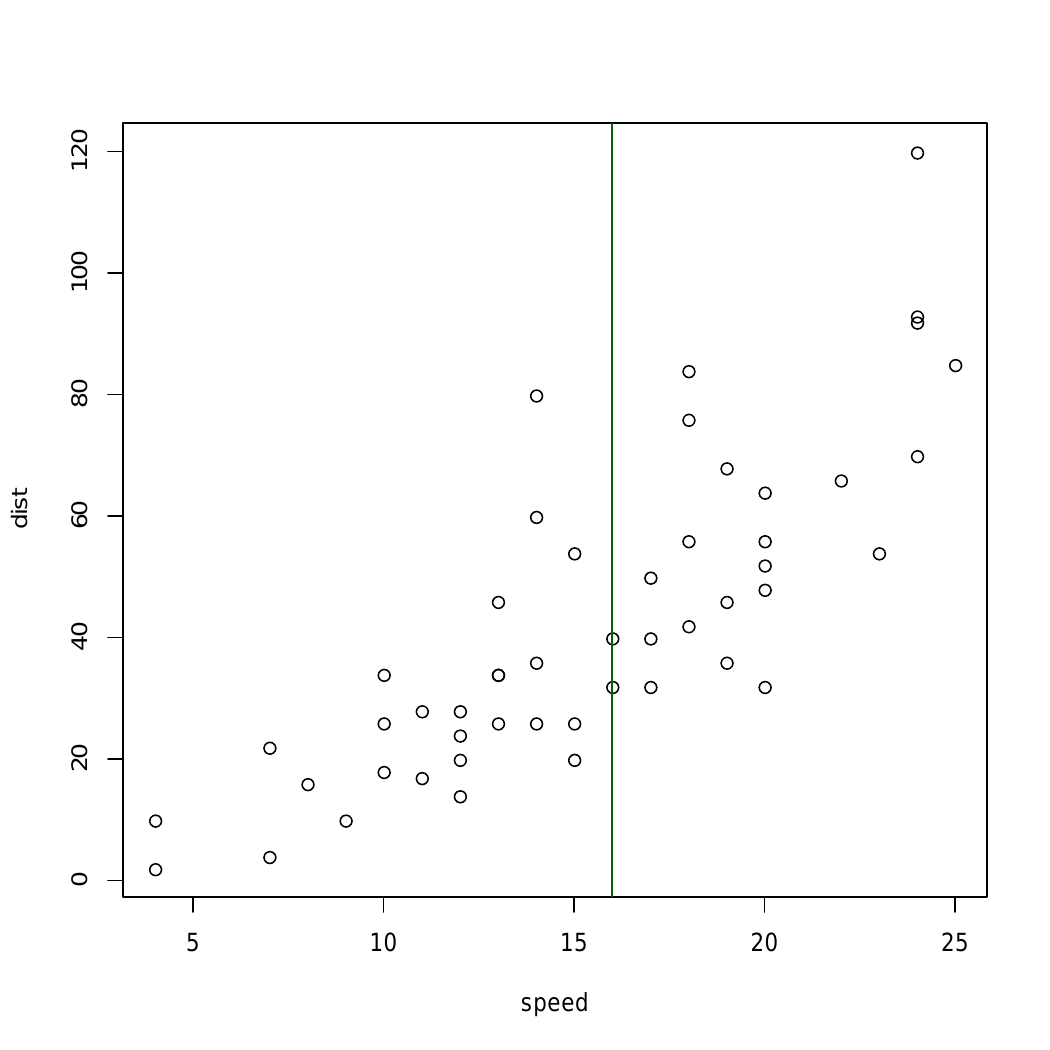
Example 1: To add a vertical line to the plot
plot(cars)
abline(v = 16, col = "darkgreen")
plot(cars)
abline(v = c(16, 22), col = c("darkgreen", "blue"),
lty = c(1, 2), lwd = c(1, 3))
set.seed(1200); mydata<-rnorm(180)
hist(mydata, col="darkgreen")
abline(v = mean(mydata), col = "blue", lwd = 4, lty = 4)
|
Output:
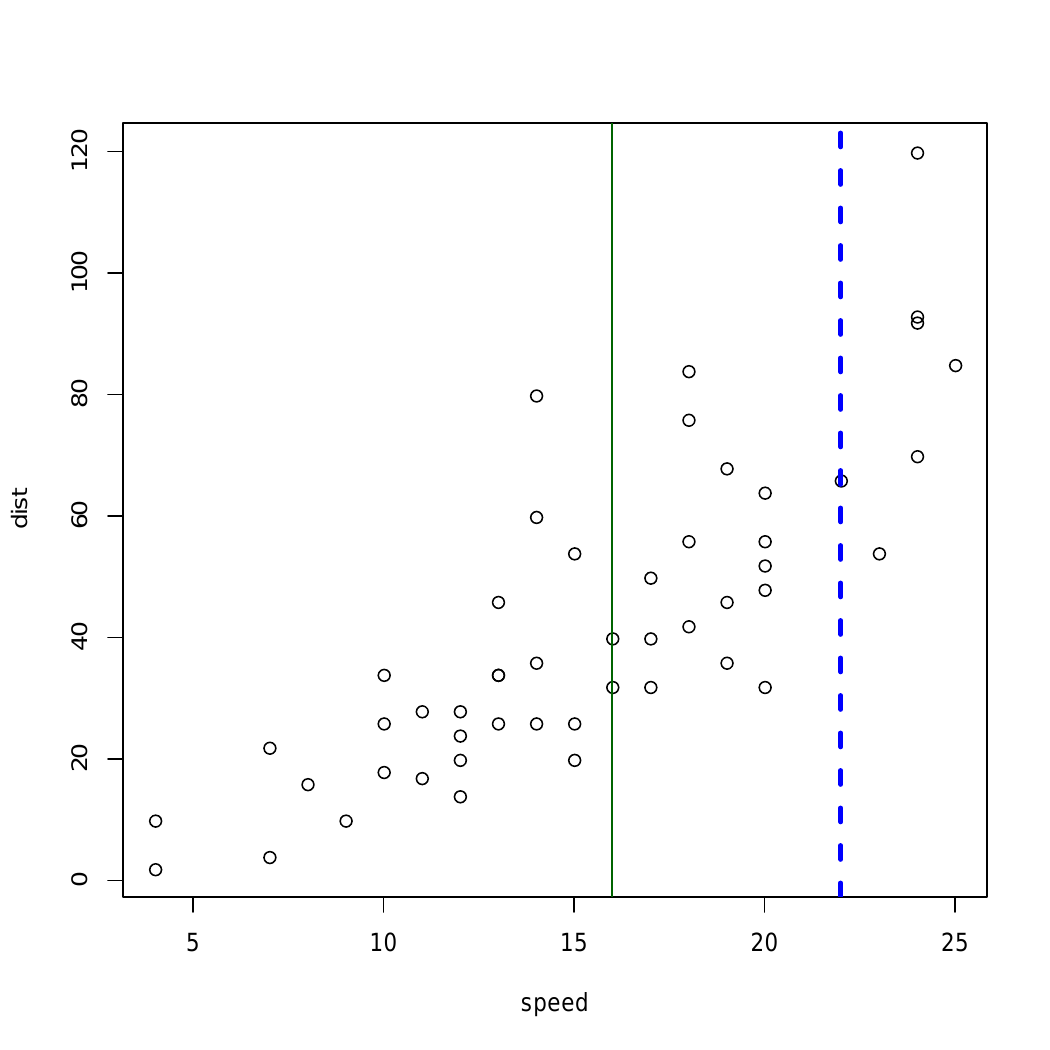
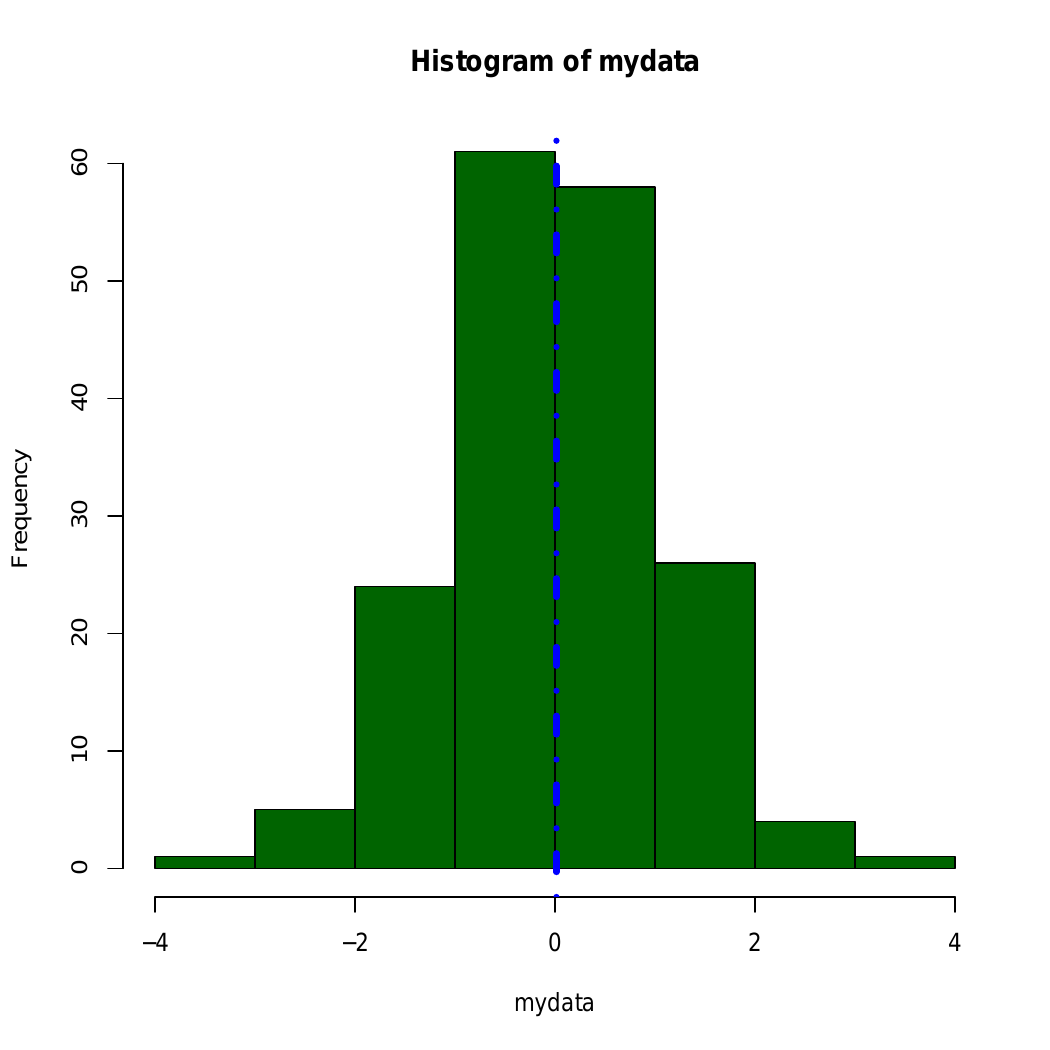
Here, in above example straight line is added using abline() to different graphical plots
Example 2: To add a horizontal line
plot(cars)
abline(h = 60, col = "darkgreen")
|
Output:
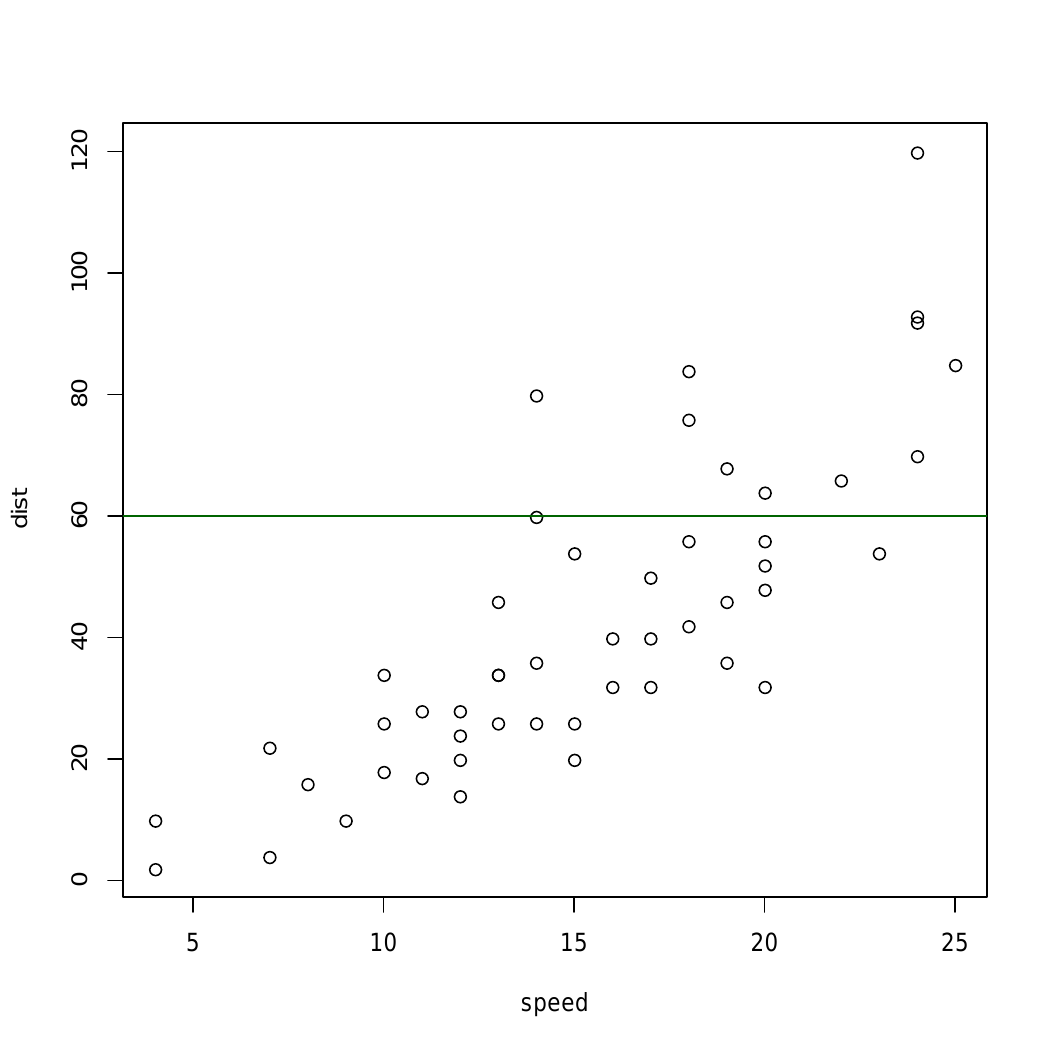
In above example abline() Function draws an horizontal line on the current plot at the specified ‘x’ coordinates.
Example 3: To add a regression line
par(mgp = c(2, 1, 0), mar = c(3, 3, 1, 1))
require(stats)
reg<-lm(dist ~ speed, data = cars)
coeff = coefficients(reg)
eq = paste0("y = ", round(coeff[1], 1), "*x ",
round(coeff[2], 1))
plot(cars, main = eq)
abline(reg, col = "darkgreen")
|
Output:
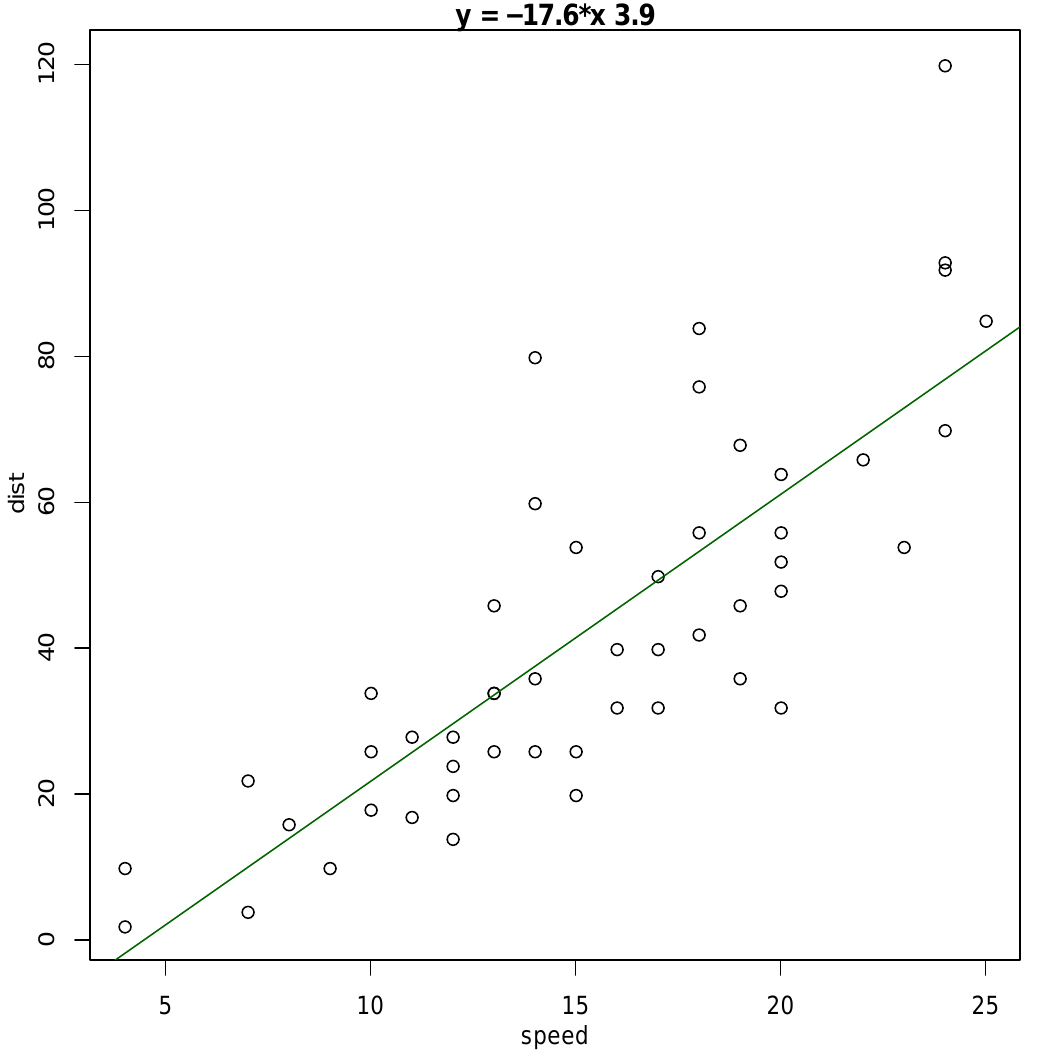
In the above example, straight-line is added using the line equation and abline() function and plot relation between speed and distance.
Like Article
Suggest improvement
Share your thoughts in the comments
Please Login to comment...