Adding error bars to a line graph with ggplot2 in R
Last Updated :
14 Feb, 2022
ggplot2 is an R language plotting package that creates complex plots from data in a data frame. It describes what variables to plot, how they are displayed, and general visual properties. It can add error bars, crossbars, line range, point range in our graph. This article is solely dedicated to adding error bars to line graphs.
Syntax: geom_errorbar()
Parameters:
- ymin or xmin : Lower Value of custom point
- ymax or xmax: Upper Value of custom point
- height: height of errorbar
- alpha: Opacity of error bar
- color: Color of error bar
- group: Differentiate points by group
- linetype
- size
Errorbar can be plotted horizontally or vertically by assigning xmin & xmax, ymin & ymax respectively.
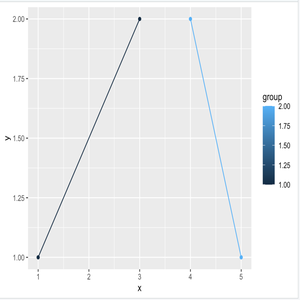
Let’s start with a simple line graph
Example:
R
library(ggplot2)
data <- data.frame(
x = c(1, 5, 3, 4),
y = c(1, 1, 2, 2),
group = c(1, 2, 1, 2),
se = c(0.1, 0.3, 0.3, 0.2))
p <- ggplot(data, aes(x, y, group = group, color=group)) + geom_point() + geom_line()
p
|
Output:
Now let us see how error bars are added to the line plot.
Approach:
- Import library
- Create data
- Create plot
- Add functions to create an errorbar with specific parameter to obtain a desired result.
- Display plot
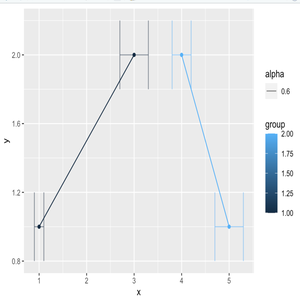
For Horizontal Errorplot, geom_errorbarh can be used and take parameters same as geom_errorbar but xmax & xmin is mandatory.
Program:
R
library(ggplot2)
data <- data.frame(
x = c(1, 5, 3, 4),
y = c(1, 1, 2, 2),
group = c(1, 2, 1, 2),
se = c(0.1, 0.3, 0.3, 0.2))
p + geom_errorbarh(aes(xmax = x + se,
xmin = x - se,
alpha=0.6,
height = .4))
|
Output:
For Vertical Errorplot, assign ymin & ymax to geom_errorbar. The size parameter can change the width of error plot as shown below.
Program 1:
R
library(ggplot2)
data <- data.frame(
x = c(1, 5, 3, 4),
y = c(1, 1, 2, 2),
group = c(1, 2, 1, 2),
se = c(0.1, 0.3, 0.3, 0.2))
p + geom_errorbar(aes(ymax = y + se,
ymin = y - se))
|
Output:
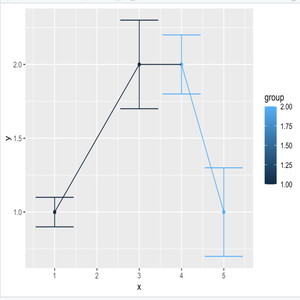
Simple Vertical errorplot
Program 2:
R
library(ggplot2)
data <- data.frame(
x = c(1, 5, 3, 4),
y = c(1, 1, 2, 2),
group = c(1, 2, 1, 2),
se = c(0.1, 0.3, 0.3, 0.2))
p + geom_errorbar(aes(ymax = y + se,
ymin = y - se,
alpha=0.6,
size=10))
|
Output:
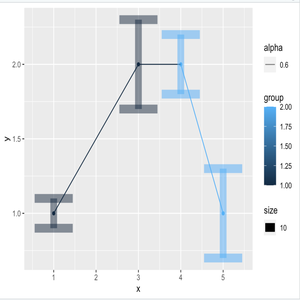
The vertical plot, size=10
Sometimes, points are overlapped in the errorbar. For that position_dodge is used to move them horizontally.
Program:
R
pd <- position_dodge(0.1)
p+ geom_errorbar(aes(xmin= x-se, xmax= x+se),
colour="green",
width=.3, position=pd) +
geom_line(position=pd) +
geom_point(position=pd, size=3,
shape=23, fill="white")
|
Output:
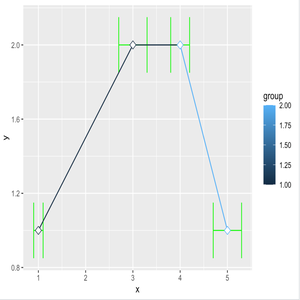
shape=23
Like Article
Suggest improvement
Share your thoughts in the comments
Please Login to comment...