Adding Data Points to world map in R
Last Updated :
20 Mar, 2024
In this article, we are going to see how to add DataPoint to the world map in R Programming Language. The world map in R can be plotted on a graphical device using various external packages in R Programming. The points can be marked and data can be annotated in these plots using various methods.
Dataset Used: >worldcities.csv
R
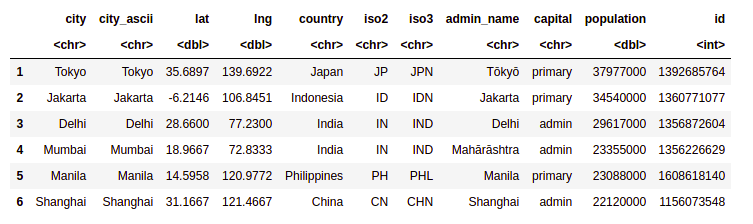
data <- read.csv("worldcities.csv")
df <- data.frame(data)
head(df)
|
Output:
Method 1: Using maps package
Maps: The “maps” package in R is used to draw and display geographical maps. It contains various databases for denoting countries, continents and seas. The package can be installed and loaded into the working space using the following command :
install.packages("maps")
The package contains the ‘world’ database, which contains descriptive images of continents and it no longer contains lakes and lake islands. The map function of this package is used to draw lines and polygons as specified by a map database, which incorporates the geographical map.
map(database = “world”)
The data can be specified in the form of latitudes and longitudes and the names of the cities. The point can then be annotated over this plot using the plot() method. It can be customized with various attributes to improve readability and enhance the graphics.
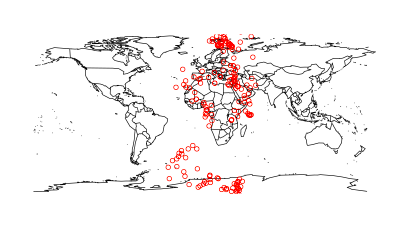
Note: We will plot first 500 cities
R
library(maps)
map(database = "world")
points(x = df$lat[1:500], y = df$lng[1:500], col = "Red")
|
Output:
Method 2: Using ggplot2 and map
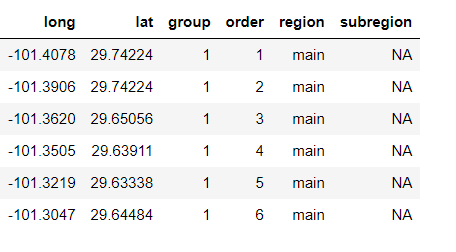
Here we are going to use ggplot2() and map, map_data() function returns the dataset of the country along with longitude and latitude.
R
library(ggplot2)
library(maps)
usa <- map_data("usa")
head(usa)
|
Output:
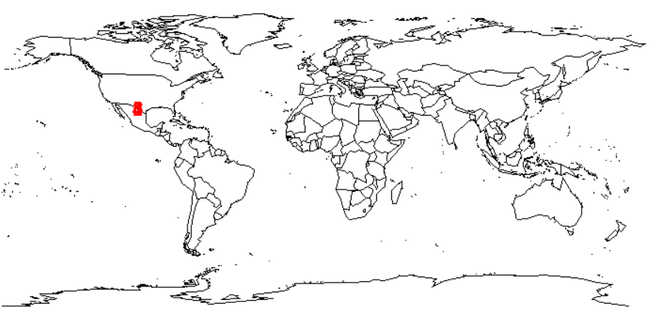
Now we plot a world map along with datapoints:
R
df = head(usa)
map(database="world")
text(x = df$long, y = df$lat, col = "Red")
|
Output:
Like Article
Suggest improvement
Share your thoughts in the comments
Please Login to comment...