Adding axis to a Plot in R programming – axis () Function
Last Updated :
14 Jul, 2020
axis() function in R Language is to add axis to a plot. It takes side of the plot where axis is to be drawn as argument.
Syntax:
axis(side, at=NULL, labels=TRUE)
Parameters:
side: It defines the side of the plot the axis is to be drawn on possible values such as below, left, above, and right.
at: Point to draw tick marks
labels: Specifies texts for tick-mark labels.
Example 1:
x <- 1:5; y = x * x
plot(x, y, axes = FALSE)
axis(side = 1, at = 1:5, labels = LETTERS[1:5])
axis(3)
|
Output:
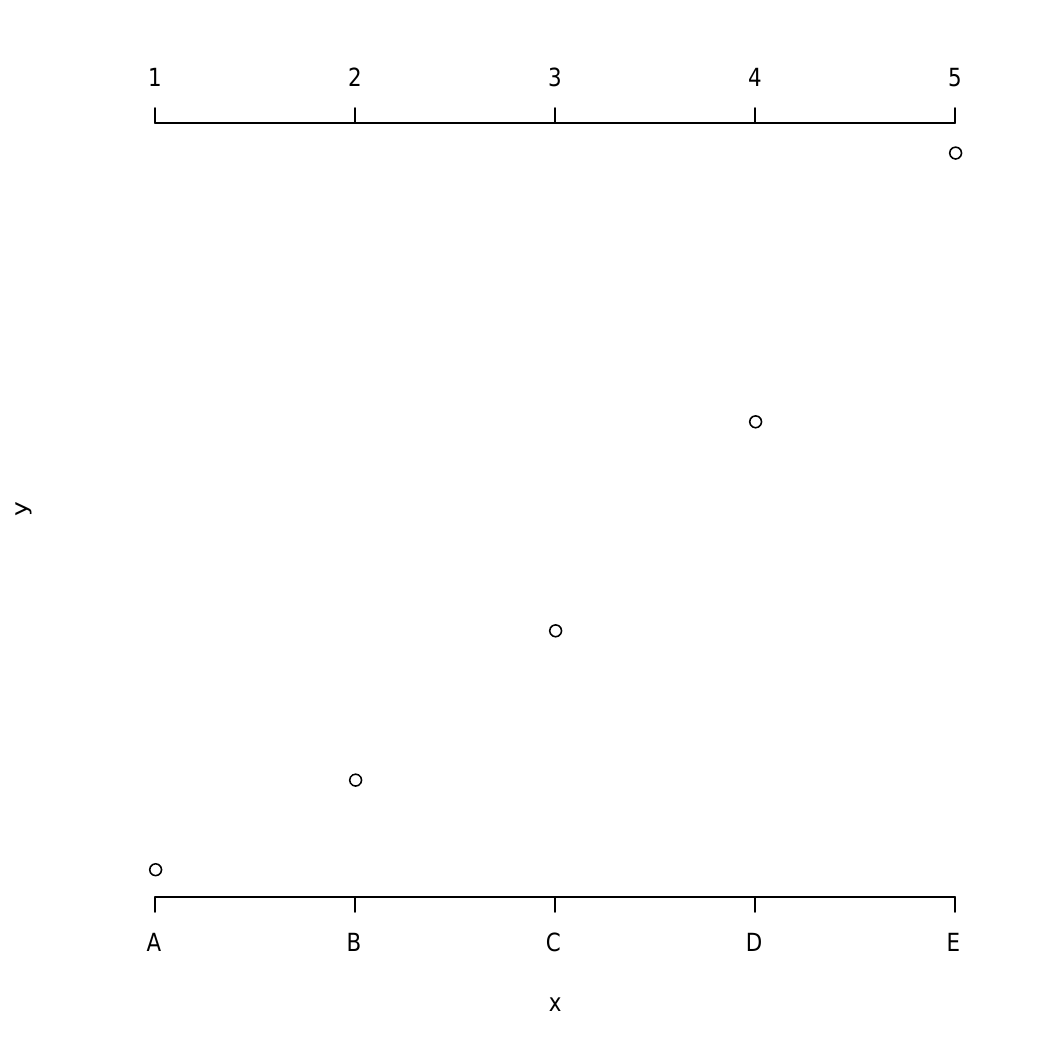
In the above example, the straight dotted line is added to the plot joining numerical and alphabetical values plot axis is drawn at the top and bottom part of the plot.
Example 2: Another example to add axes by drawing box
x<-1:5; y = x * x
plot(x, y, axes = FALSE)
axis(side=1, at = 1:5, labels = LETTERS[1:5])
axis(3)
box()
|
Output:
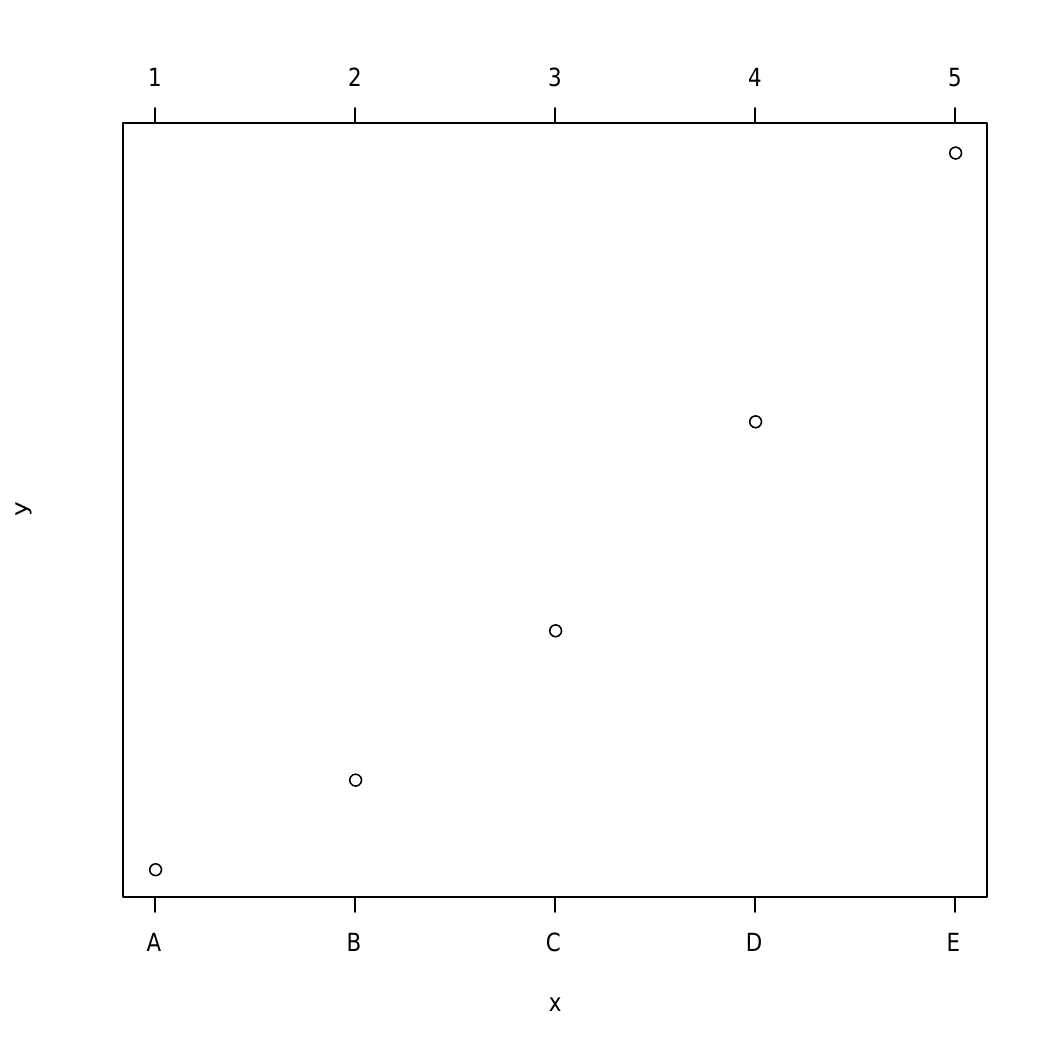
Here, a box is drawn to drawn using box() function around the axis so that it looks like a usual plot.
Example 3:
x<-1:4; y=x*x
plot(x, y, pch = 18, col = "darkgreen", type = "b",
frame = FALSE, xaxt = "n")
axis(1, 1:4, LETTERS[1:4], col.axis="blue")
axis(3, col = "darkgreen", lty = 2, lwd = 4)
axis(4, col = "black", col.axis = "blue", lwd = 4)
|
Output:
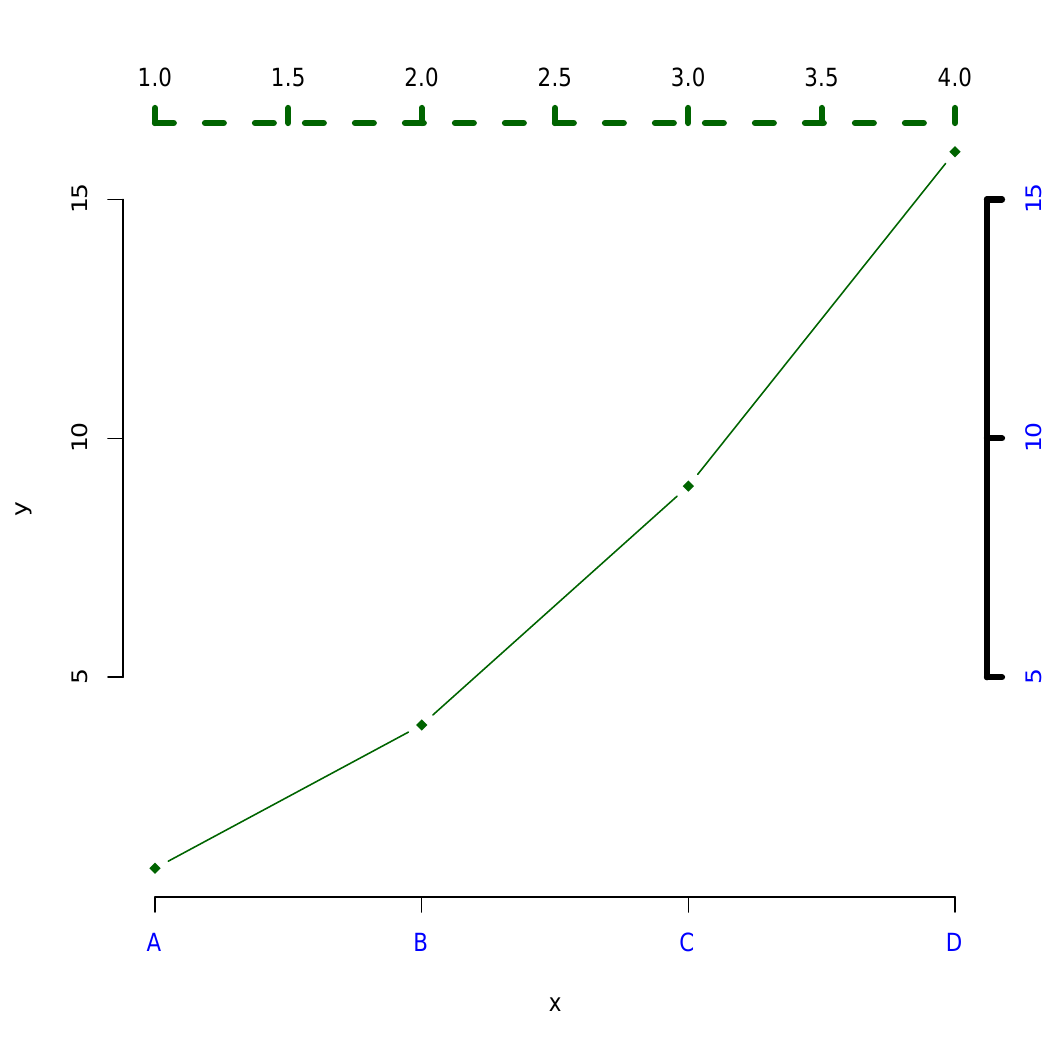
Here, the different type of axis are drawn implementing modification in line width(lwd) and line type(lty).
Like Article
Suggest improvement
Share your thoughts in the comments
Please Login to comment...