Add Text to ggplot2 Plot in R
Last Updated :
30 May, 2021
In this article, we are going to see how to add Text to the ggplot2 plot in R Programming Language.
To do this annotate() is used. It is useful for adding small annotations (such as text labels) or if you have your data in vectors, and for some reason don’t want to put them in a data frame.
Syntax:
annotate(geom,x = NULL,y = NULL, xmin = NULL, xmax = NULL, ymin = NULL, ymax = NULL, xend = NULL, yend = NULL, …, na.rm = FALSE)
Parameters:
- geom: name of geom to use for annotation
- x, y, xmin, ymin, xmax, ymax, xend, yend: positioning aesthetics – you must specify at least one of these.
- …: Other arguments passed on to layer(). These are often aesthetics, used to set an aesthetic to a fixed value, like color = “red” or size = 3.
- na.rm: If FALSE, the default, missing values are removed with a warning.
Example:
R
library("ggplot2")
gfg_data <- data.frame(x = c(1,2,3,4,5),
y = c(4,3,2,5,1))
gfg_data
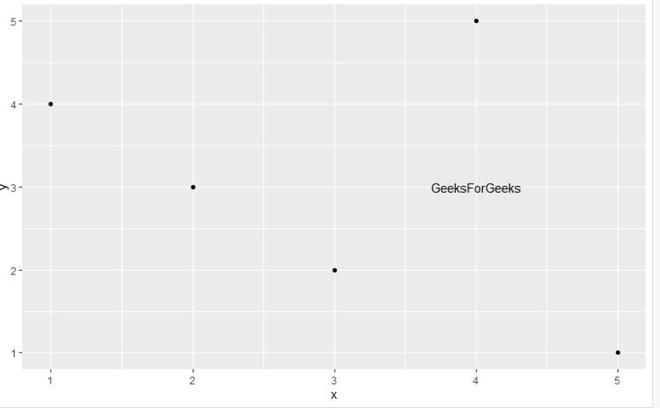
gfg_plot<- ggplot(gfg_data, aes(x, y)) +
geom_point()
gfg_plot + annotate("text", x = 4, y = 3,
label = "GeeksForGeeks")
|
Output:
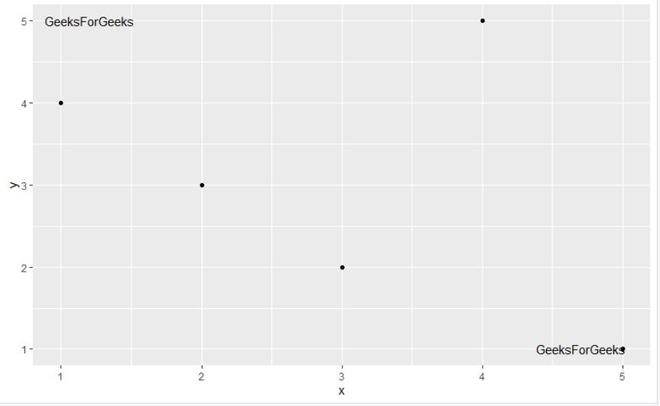
To annotate multiple test elements to the ggplot2 plot user needs to call annotate() function of the ggplot2 package multiple times with the required parameters in the R programming language.
Example:
R
library("ggplot2")
gfg_data <- data.frame(x = c(1,2,3,4,5),
y = c(4,3,2,5,1))
gfg_data
gfg_plot<- ggplot(gfg_data, aes(x, y)) +
geom_point()
gfg_plot + annotate("text", x = 1.2, y = 5,
label = "GeeksForGeeks") +
annotate("text", x = 4.7, y = 1,
label = "GeeksForGeeks")
|
Output:
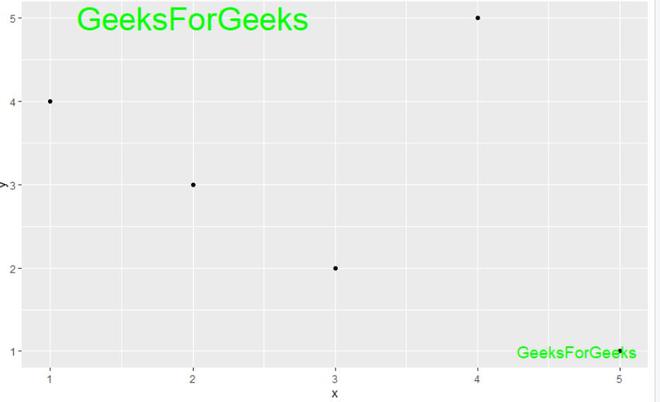
To modify the color and the size of the text added to the ggplot2 plot using annotate() function, the user needs to add col and size as the arguments of the annotate function from the ggplot2 package and specify the required parameter into this function and this will lead to the change in the size and the color of the text added to ggplot2 plot in the R programming language.
Example:
R
library("ggplot2")
gfg_data <- data.frame(x = c(1,2,3,4,5),
y = c(4,3,2,5,1))
gfg_data
gfg_plot<- ggplot(gfg_data, aes(x, y)) +
geom_point()
gfg_plot + annotate("text", x = 2, y = 5,
label = "GeeksForGeeks",
col = "green", size = 10) +
annotate("text", x = 4.7, y = 1,
label = "GeeksForGeeks",
col = "green", size = 5)
|
Output:
Like Article
Suggest improvement
Share your thoughts in the comments
Please Login to comment...