Add perpendicular caps to error bars in Matplotlib
Last Updated :
26 Dec, 2020
Prerequisites: Matplotlib
The errorbar() function in pyplot module of matplotlib library is used to plot y versus x as lines and/or markers with attached errorbars. For our requirement we need to specifically focussing on capsize attribute of this function. Simply providing a value to it will produce our required functionality.
Syntax: matplotlib.pyplot.errorbar(x, y, yerr=None, xerr=None, fmt=”, ecolor=None, elinewidth=None, capsize=None, barsabove=False, lolims=False, uplims=False, xlolims=False, xuplims=False, errorevery=1, capthick=None, \*, data=None, \*\*kwargs)
Parameters: This method accept the following parameters that are described below:
- x, y: These parameters are the horizontal and vertical coordinates of the data points.
- fmt: This parameter is an optional parameter and it contains the string value.
- capsize: This parameter is also an optional parameter. And it is the length of the error bar caps in points with default value NONE.
- barsabove: This parameter is also an optional parameter. It contains boolean value True for plotting errorsbars above the plot symbols.Its default value is False.
- errorevery: This parameter is also an optional parameter. They contain integer values which is used to draw error bars on a subset of the data.
Approach
- Import module
- Create data
- Provide error values
- Pass all the values to errorbar() function along with capsize attribute and its value
- Display plot
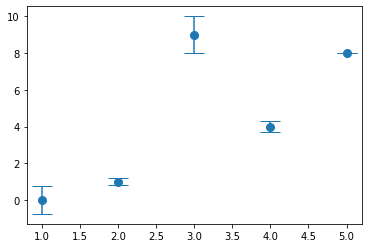
Example 1:
Python3
import matplotlib.pyplot as plt
x_values = [5, 4, 3, 2, 1]
y_values = [8, 4, 9, 1, 0]
y_error = [0, 0.3, 1, 0.2, 0.75]
plt.errorbar(x_values, y_values, yerr=y_error,
fmt='o', markersize=8, capsize=10)
plt.show()
|
Output:
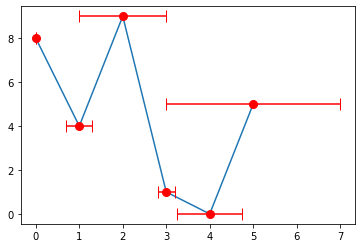
Example 2:
Python3
import matplotlib.pyplot as plt
x_values = [0, 1, 2, 3, 4, 5]
y_values = [8, 4, 9, 1, 0, 5]
plt.plot(x_values, y_values)
x_error = [0, 0.3, 1, 0.2, 0.75, 2]
plt.errorbar(x_values, y_values, xerr=x_error,
fmt='o', markersize=8, capsize=6, color="r")
plt.show()
|
Output:
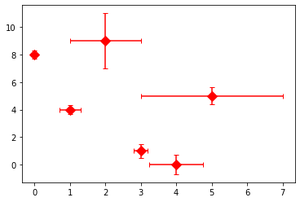
Example 3:
Python3
import matplotlib.pyplot as plt
x_values = [0, 1, 2, 3, 4, 5]
y_values = [8, 4, 9, 1, 0, 5]
x_error = [0, 0.3, 1, 0.2, 0.75, 2]
y_error = [0.3, 0.3, 2, 0.5, 0.7, 0.6]
plt.errorbar(x_values, y_values, xerr=x_error, yerr=y_error,
fmt='D', markersize=8, capsize=3, color="r")
plt.show()
|
Output:
Share your thoughts in the comments
Please Login to comment...