Add Panel Border to ggplot2 Plot in R
Last Updated :
28 Apr, 2021
In this article, we will use theme() function to add panel border to the plot in R Programming Language. Here we will create a scatter plot, but you can apply it to any plot and add a Panel Border to that one.
Approach:
- Specify the data object, and it has to be a dataframe. Here it has two variable named year and point.
- Call ggplot() function. Put first parameter ‘data’ and then set the aesthetic function ‘aes()’.
- Inside aes() function, set the year variable for the X Axis, use the point variable for the Y Axis.
- Call ggtitle() to set the title of the plot.
- Call geom_point() function. Here inside geom_point() function, we use aes() with size parameter for setting the size of points and also use col parameter to set the color of points.
- Add Panel Border to plot using theme() function and panel.border as its parameter. To add Panel Border to R plot we simply add theme() function to ggplot() function. Inside theme() function, we have to specify panel.border parameter to add panel border around plot and use element_rect() function as value of panel.border parameter.
Syntax: theme(panel.border)
Parameter: theme() has many parameters to specify the theme of plot. we can use them as per our requirements but for add panel border to plot, we will use only panel.border parameter and specify element_rect() function as it’s value.
Return: Theme of the plot.
element_rect() is used for specifying borders and backgrounds.
Syntax:
element_rect(color = “color_name”, fill = NULL, size = NULL, linetype = NULL)
Parameter:
- fill : Specifies the color by which we fill whole rectangle.
- color : For specifying border color.
- size : For specifying border size.
- linetype : For specifying border line type
Return: Border around plot.
Dataset in use:
| |
year |
point |
| 1 |
2011 |
10 |
| 2 |
2012 |
20 |
| 3 |
2013 |
30 |
| 4 |
2014 |
40 |
| 5 |
2015 |
50 |
Let just first create a regular scatter plot to understand the difference better.
Example:
R
library(ggplot2)
data <- data.frame(year = c(2011, 2012, 2013, 2014, 2015),
point = c(10, 20, 30, 40, 50))
ggplot(data, aes(year, point)) +
geom_point()+
ggtitle("Scatter Plot")
|
Output:
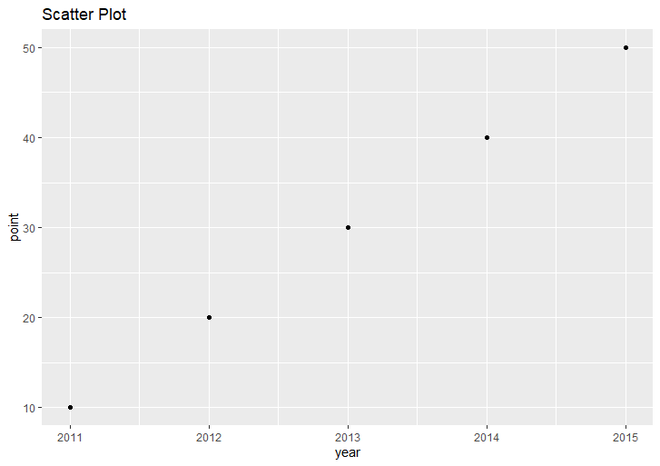
Simple Scatter plot using ggplot2
Now let’s add a border to it and display the result.
Example:
R
library(ggplot2)
data <- data.frame(year = c(2011, 2012, 2013, 2014, 2015),
point = c(10, 20, 30, 40, 50))
ggplot(data, aes(year, point)) +
geom_point()+
ggtitle("Scatter Plot with Panel Border")+
theme(panel.border = element_rect(color = "green",
fill = NA,
size = 10))
|
Output:
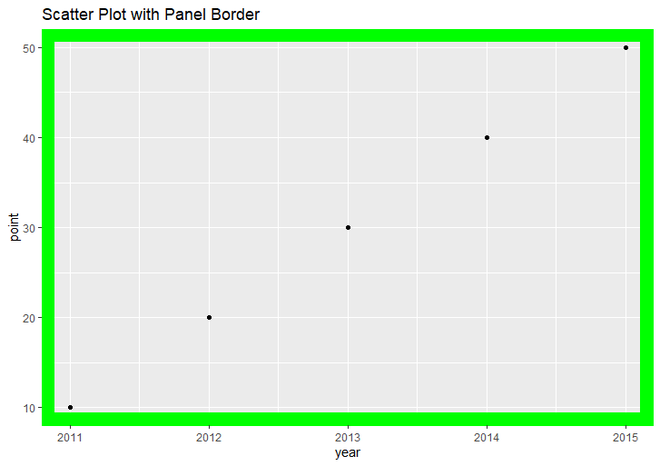
Scatter Plot with Panel Border
Like Article
Suggest improvement
Share your thoughts in the comments
Please Login to comment...