Add Multiple New Columns to data.table in R
Last Updated :
16 Jul, 2021
In this article, we will discuss how to Add Multiple New Columns to the data.table in R Programming Language. To do this we will first install the data.table library and then load that library.
Syntax:
install.packages(“data.table”)
After installing the required packages out next step is to create the table. We create a table with the help of a “data.table” and store that table in a variable. Later if the requirement persists a new column can be added by first creating a column as list and then adding it to the existing data.table by one of the following methods.
Method 1: Using :=
A column can be added to an existing data table using := operator.
Syntax:
‘:='(data type, constructors)
Here ‘:’ represents the fixed values and ‘=’ represents the assignment of values. So, they together represent the assignment of fixed values. Therefore, with the help of “:=” we will add 2 columns in the above table. So, to do this first we will create the columns and try to put data in it, we will do this by creating a vector and put data in it.
Given below are various examples to support this.
Example:
R
data <- data.table(x1 = 1:6,
x2 = 3:8)
y1 <- 10:15
y2 <- 4:9
data[ , `:=` (y1 = y1, y2 = y2)]
data
|
Output:
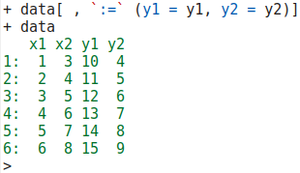
fig 3: Table after adding columns
We can also add the column in the table using the data that already exist in the table. While adding the data with the help of colon-equal symbol we define the name of the column i.e. z1 and z2 then during adding data we multiply the ‘x1’ and ‘x2’ in the z1 column, and we multiply the ‘y1’ and ‘y2’ in the z2 column and at last, we print the table.
Example:
R
data <- data.table(x1 = 1:6,
x2 = 3:8)
y1 <- 10:15
y2 <- 4:9
data[, ':='(y1=y1,y2=y2)]
data[, ':='(z1=x1*x2,z2=y1*y2)]
data
|
Output:
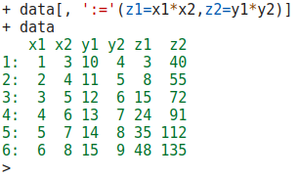
fig 6: Table after adding z1 and z2
Method 2: Using “.” and “by”
In this method, we use the dot “.” with the “by”. Here “.” is used to put the data in the new columns and by is used to add those columns to the data table. So, they together are used to add columns to the table.
Example:
R
data <- data.table(x1 = 1:6,
x2 = 3:8)
y1 <- 10:15
y2 <- 4:9
data[, ':='(y1=y1,y2=y2)]
data[, ':='(z1=x1*x2,z2=y1*y2)]
data[, .(a1=x1+y1+z1,a2=x2+y2+z2),
by=.(x1,x2,y1,y2,z1,z2)]
|
Output:
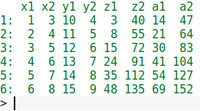
fig 7: Table after adding a1, a2
Like Article
Suggest improvement
Share your thoughts in the comments
Please Login to comment...