Add legend for multiple lines in R using ggplot2
Last Updated :
24 Jun, 2021
In this article, we are going to see how to add legends for multiple line plots in R Programming Language using ggplot2. First, you need to install the ggplot2 package if it is not previously installed in R Studio.
The functions used to create the line plots are :
- geom_line( ) : To plot the line and assign its size, shape, color, etc.
Syntax:
geom_line(mapping=NULL, data=NULL, stat=”identity”, position=”identity”,…)
- geom_point( ) : It is used to add points to the end of the lines. It is used to assign the shape, size, color of the points.
Syntax:
geom_point(mapping=NULL, data=NULL, stat=”identity”, position=”identity”,…)
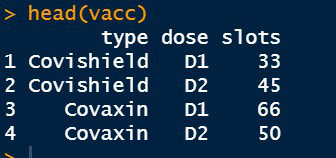
Dataset in use :
Let us first plot the initial graph without any modification so that the difference is apparent.
Example:
R
vacc <- data.frame(catgry=rep(c("Covishield", "Covaxin"), each=2),
dose=rep(c("D1", "D2"),2),
slots=c(33, 45, 66, 50))
library(ggplot2)
plt <- ggplot(data=vacc, aes(x=dose, y=slots, group=catgry))+
geom_line()+
geom_point(color="red", size=3)+
labs(x="Doses",y="Free Slots")+
ggtitle("Vaccine Details")
plt
|
Output:
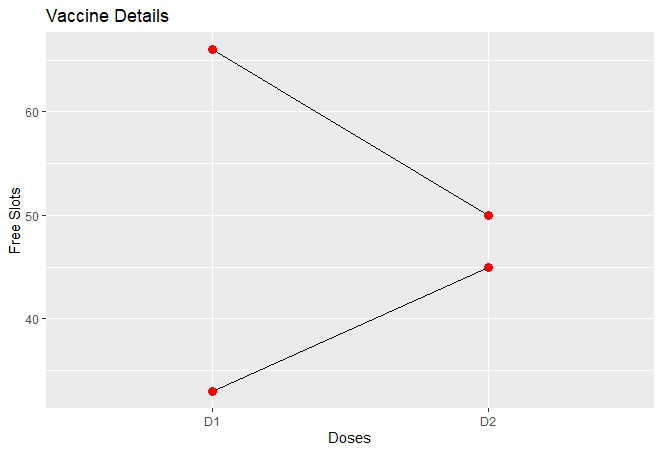
The line plots are plotted successfully. We can’t interpret the lines directly i.e. which line belongs to Covaxin and the same for Covishield just by seeing the above plot. So, we need legends that will help in segregating these lines on the basis of groups.
Adding Legends
There is no direct way in R to add legends in case of multiple lines like in Excel and other scripting languages. So, to add legends we need to distribute the lines into multiple groups on the basis of coloring. The key idea is to differentiate the lines by assigning different colors to each line and make them into separate groups. Now, the lines will be categorized into different groups and legends will be added automatically in the plot.
Method 1: Default grouping
In this, we directly use the color attribute within geom_line() with the attribute that will be used for differentiating.
Syntax:
geom_line(aes(color=group_var))
group_var is the name of the variable in the data frame which is used to segregate the lines.
Example:
R
vacc <- data.frame(catgry=rep(c("Covishield", "Covaxin"), each=2),
dose=rep(c("D1", "D2"),2),
slots=c(33, 45, 66, 50))
library(ggplot2)
plt <- ggplot(data=vacc, aes(x=dose, y=slots, group=catgry))+
geom_line()+
geom_point(color="red", size=3)+
labs(x="Doses",y="Free Slots")+
ggtitle("Vaccine Details")
plt
plt+geom_line(aes(color=catgry))
|
Output:
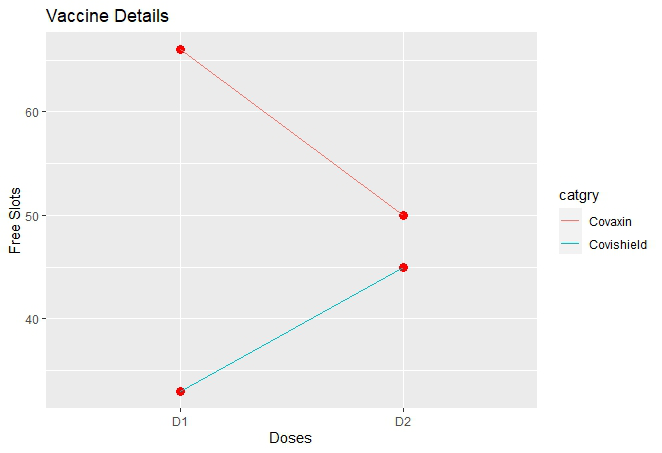
Method 2: Manual grouping
R provides us with the function scale_color_manual( ) which helps to assign color manually. We can assign either the color name or the color code for the lines manually using this function.
Syntax:
scale_color_manual(..,values,aesthetics=”color”)
Parameter:
- color : Color code which is written in the form of “#RRBBGG” or simply Color name.
- values : Forming a vector to assign colors to multiple lines.
It is similar to the previous method but here users have the flexibility to assign color to the lines based on their choices.
Example:
R
vacc <- data.frame(catgry=rep(c("Covishield", "Covaxin"), each=2),
dose=rep(c("D1", "D2"),2),
slots=c(33, 45, 66, 50))
library(ggplot2)
plt <- ggplot(data=vacc, aes(x=dose, y=slots, group=catgry))+
geom_line()+
geom_point(color="black", size=3)+
labs(x="Doses",y="Free Slots")+
ggtitle("Vaccine Details")
plt
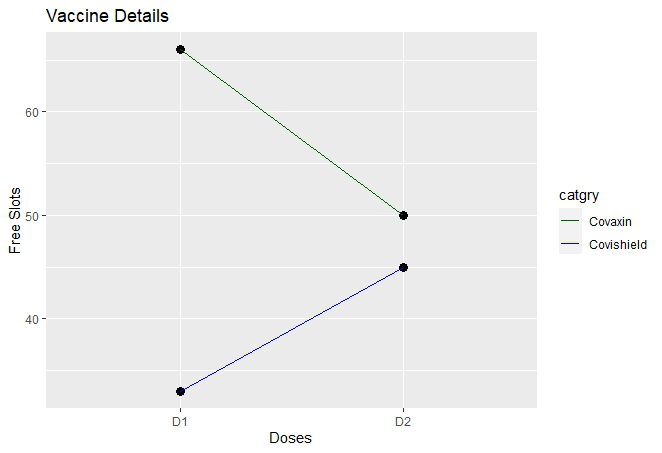
plt+geom_line(aes(color=catgry))+
scale_color_manual(values=c("#006000", "blue"))
|
Output:
Like Article
Suggest improvement
Share your thoughts in the comments
Please Login to comment...