Add Common Main Title for Multiple Plots in R
Last Updated :
29 Jun, 2021
In this article, we will be looking at the two different approaches to add a common main title for multiple plots in base R and ggplot2 package in the R programming language.
Method 1: Using par and mtext() function
In this approach to add a common main title for multiple plots, the user needs to call the par() and the mtext() function, which is the in-built functions of the R programming language, here the user needs to also use the mfrow argument of the par function and pass the required parameters in both functions, then create a matrix of nrows x ncols plots which will lead to the formation of the multiple plots in the single plots and the mtext() function will add the text is written in one of the four margins of the current figure region which will lead to the addition of the common main title for multiple plots in the R programming language.
- par() function can be used to set or query graphical parameters.
Syntax:
par(…, no.readonly = FALSE)
Parameter:
- …: arguments in tag = value form, or a list of tagged values.
- no.readonly: logical; if TRUE and there are no other arguments, only parameters are returned which can be set by a subsequent par() call on the same device.
- mtext() function is used to text written in one of the four margins of the current figure region or one of the outer margins of the device region
Syntax:
mtext(text, side = 3, line = 0, outer = FALSE, at = NA, adj = NA, padj = NA, cex = NA, col = NA,
font = NA, …)
Parameter:
- text: a character or expression vector specifying the text to be written. Other objects are coerced by as.graphicsAnnot.
- side: on which side of the plot (1=bottom, 2=left, 3=top, 4=right).
- line: on which MARgin line, starting at 0 countings outwards.
- outer: use outer margins if available.
- at: give the location of each string in user coordinates.
- adj: adjustment for each string in reading direction.
- padj: adjustment for each string perpendicular to the reading direction.
- cex: character expansion factor. NULL and NA are equivalent to 1.0.
- col: color to use. Can be a vector. NA values (the default) mean use par(“col”).
- font: font for text. Can be a vector. NA values (the default) mean use par(“font”).
- …: Further graphical parameters, including family, las and xpd.
Example:
Data in use:
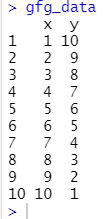
R
gfg_data <- data.frame(x = 1:10,y = 10:1)
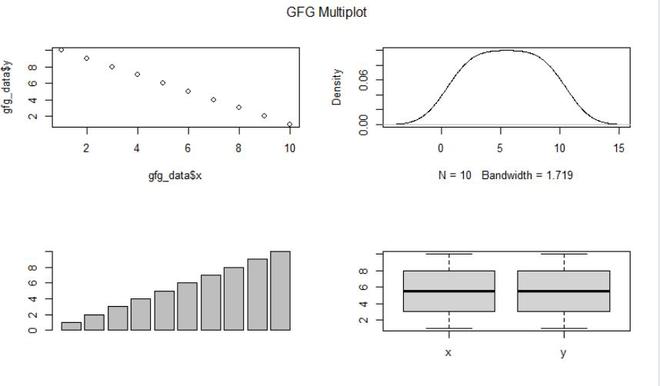
par(mfrow = c(2, 2))
plot(gfg_data$x, gfg_data$y)
plot(density(gfg_data$x), main = "")
barplot(gfg_data$x)
boxplot(gfg_data)
mtext("GFG Multiplot", side = 3, line = - 2, outer = TRUE)
|
Output:
Method 2: Using ggplot2 and patchwork Packages
In this approach to add a common main title for multiple plots, the user first needs to install and import the ggplot2 and the patchwork package in the R console, and with the help of the ggplot2 package user will be able to plot multiple plots and with the help of the patch package and call the plot_annotation() with the required parameters and the user will be able to add the common main title to the multiple plots created by the ggplot2 package and further, it will lead to the addition of common main title for multiple plots.
plot_annotation() function is mainly used to annotate the final patchwork.
Syntax:
plot_annotation( title = NULL, subtitle = NULL, caption = NULL, tag_levels = NULL, tag_prefix = NULL, tag_suffix = NULL, tag_sep = NULL, theme = NULL)
Parameters:
- title, subtitle, caption: Text strings to use for the various plot annotations.
- tag_levels: A character vector defining the enumeration format to use at each level.
- tag_prefix, tag_suffix: Strings that should appear before or after the tag.
- tag_sep: A separator between different tag levels
- theme: A ggplot theme specification to use for the plot. Only elements related to the titles as well as plot margin and background is used.
Example:
Data in use:
R
library("ggplot2")
library("patchwork")
gfg_data <- data.frame(x = 1:10,y = 10:1)
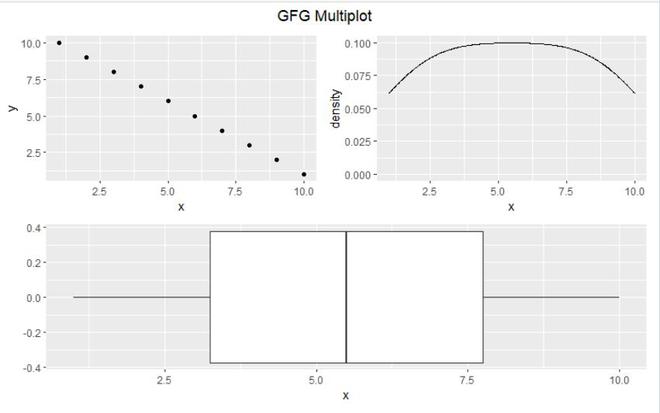
gfg_plot_1 <- ggplot(gfg_data, aes(x, y)) + geom_point()
gfg_plot_2 <- ggplot(gfg_data, aes(x)) + geom_density()
gfg_plot_3 <- ggplot(gfg_data, aes(x)) +geom_boxplot()
gfg_plot <- (gfg_plot_1 + gfg_plot_2) / (gfg_plot_3 ) +
plot_annotation(title = "GFG Multiplot") & theme(plot.title = element_text(hjust = 0.5))
gfg_plot
|
Output:
Like Article
Suggest improvement
Share your thoughts in the comments
Please Login to comment...