Add Bold and Italic text to ggplot2 Plot in R
Last Updated :
21 Apr, 2021
In this article, we will discuss how to add Bold and Italic Text to a plot using ggplot2 in the R Programming language.
To add the bold and italic text we will be using the annotate() function from the ggplot2 library in R language, this function helps to add the text to the graph with different variations in the ggplot2 plot.
Install the ggplot2 library:
install.packages("ggplot2")
To import/load the ggplot2 library:
library("ggplot2")
Annotate function: This function adds geoms to a plot, the properties of the geoms are not mapped from variables of a data frame, but are instead passed in as vectors. This is useful for adding small annotations or if you have your data in vectors, and for some reason don’t want to put them in a data frame. In other words, it helps the user to add text with different properties to the ggplot2 plot.
Syntax: annotate(geom,x = NULL,y = NULL,xmin = NULL,xmax = NULL,ymin = NULL,max = NULL,xend = NULL,yend = NULL,…,label Fontface,na.rm = FALSE)
Parameters:-
- geom:-name of geom to use for annotation
- x, y, xmin, ymin, xmax, ymax, xend, yend:-positioning aesthetics – you must specify at least one of these.
- label:-a character string containing a variable’s label
- Fontface:- The font face
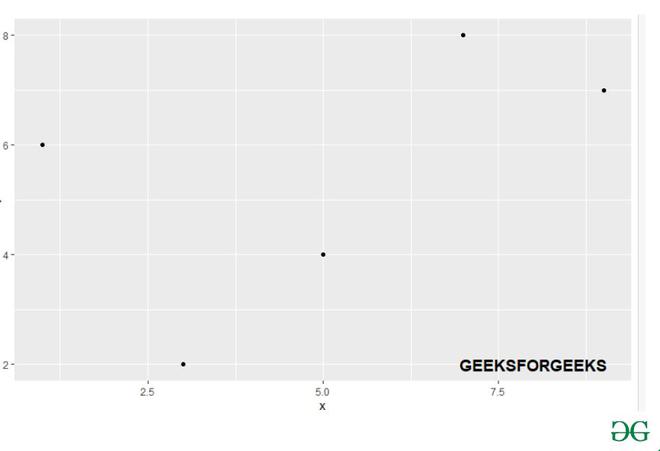
Example1: Adding a Bold Text to ggplot2 Plot.
In this example, firstly we will be creating a data frame of 5elements and plotting it with the help of ggplot() function in the ggplot2 library. And then with the annotate() function and passing the bold parameter in the fontface, we will add bold text to it.
Code:
R
library("ggplot2")
gfg_data=data.frame(x = c( 7, 5, 1, 3, 9),
y = c(8, 4, 6, 2, 7));
gfg_plot <- ggplot(gfg_data, aes(x, y)) +geom_point()
gfg_plot +annotate("text", x =8, y = 2, size = 5,
label = "GEEKSFORGEEKS",
fontface = "bold")
|
Output:
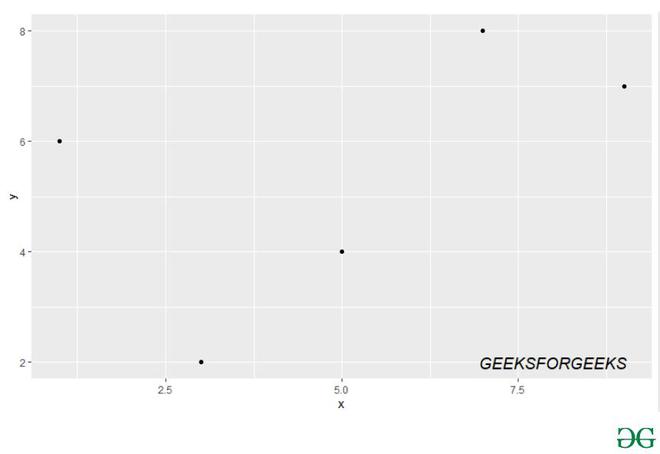
Example 2: Adding an italic Text to ggplot2 Plot.
In this example, firstly we will be creating a data frame of 10 elements and plotting it with the help of ggplot() function in the ggplot2 library. And then with the annotate() function and passing the italic parameter in the fontface, we will add italic text to it.
R
library("ggplot2")
gfg_data = data.frame(x = c(7, 5, 1, 3, 9),
y = c(8, 4, 6, 2, 7));
gfg_plot <- ggplot(gfg_data, aes(x, y)) +geom_point()
gfg_plot +annotate("text", x = 8, y = 2, size = 5,
label = "GEEKSFORGEEKS",
fontface = "italic")
|
Output:
Like Article
Suggest improvement
Share your thoughts in the comments
Please Login to comment...