3D Streamtube Plots using Plotly in Python
Last Updated :
05 Sep, 2020
Plotly is a Python library that is used to design graphs, especially interactive graphs. It can plot various graphs and charts like histogram, barplot, boxplot, spreadplot, and many more. It is mainly used in data analysis as well as financial analysis. plotly is an interactive visualization library.
3D Streamtube Plots
In plotly, the streamtube plot, parameter includes X, Y, and Z, which set the coordinates with vector fields. U, V, and W which set X, Y, and Z component of vector fields. A streamtube is a tubular region surrounded by streamlines that form a closed loop.
Syntax: plotly.graph_objects.Streamtube(arg=None, hoverinfo=None, showscale=None, u=None, v=None, w=None, x=None, y=None, z=None, **kwargs)
Parameters:
arg: dict of properties compatible with this constructor or an instance of plotly.graph_objects.Streamtube
hoverinfo: Determines which trace information appear on hover. If none or skip are set, no information is displayed upon hovering. But, if none is set, click and hover events are still fired.
showscale: Determines whether or not a colorbar is displayed for this trace.
u: Sets the x components of the vector field.
v: Sets the y components of the vector field.
w: Sets the z components of the vector field.
x: Sets the x coordinates of the vector field.
y: Sets the y coordinates of the vector field.
z: Sets the z coordinates of the vector field.
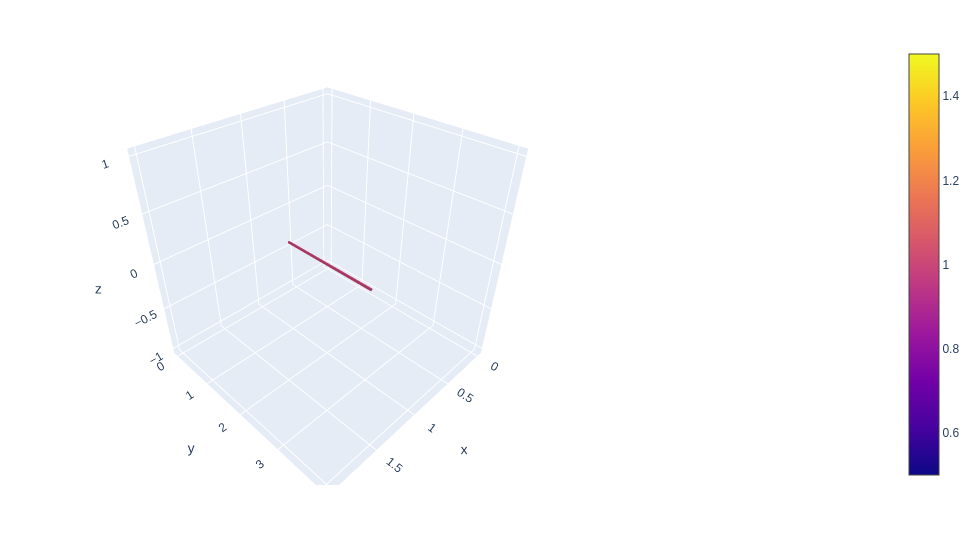
Example:
Python3
import plotly.graph_objects as go
fig = go.Figure(data=go.Streamtube(x=[1, 1, 1], y=[1, 1, 2],
z=[0, 0, 0], u=[0, 0, 0],
v=[1, 1, 1], w=[0, 0, 0]))
fig.show()
|
Output:
Changing Tube diameter
The diameter of tubes can be determined by local divergence of the vector field. The norms are proportionate but the direction of the vector is different and it result in different divergence field.
Example:
Python3
import plotly.graph_objects as go
import numpy as np
x, y, z = np.mgrid[0:20, 0:20, 0:20]
x = x.flatten()
y = y.flatten()
z = z.flatten()
u = np.zeros_like(x)
v = np.zeros_like(y)
w = z**2
fig = go.Figure(data=go.Streamtube(x=x, y=y, z=z, u=u, v=v, w=w))
fig.show()
|
Output:
Like Article
Suggest improvement
Share your thoughts in the comments
Please Login to comment...