2D Line Plot in MATLAB
Last Updated :
29 May, 2021
‘2D’ stands for 2-dimensional and a 2D line is a line that is moved in 2-dimensions. A line in 2D means that we could move in forward and backward direction but also in any direction like left, right, up, down.
In MATLAB we have a function named plot() which allows us to plot a line in 2 directions.
Syntax:
plot(X,Y)
where X and Y represent the x and the y axis of the plane. The X and Y both are can be vectors or matrices but there are some conditions to plot the graph and these conditions are mentioned below:
Condition 1: If X and Y both are vectors then they must be of equal length.
Condition 2: If X and Y both are Matrices then they must be of equal size.
Condition 3: If one of X or Y is a vector and the other is a matrix, then the matrix must have dimensions such that one of its dimensions equals the vector length.
Condition 4: If one is a scalar and the other is either a scalar or a vector, then discrete points must be plotted.
Now let’s move to some examples.
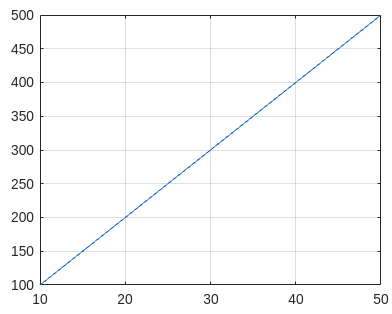
Example 1: Draw a simple line:
MATLAB
x=[10,20,30,40,50]
y=[100,200,300,400,500]
plot(x,y)
grid on
|
Output :
Example 2: Draw a line with only 1 axis coordinates as input:
Note: If you give only 1 axis then the plot() function takes it as coordinates of the y-axis and by default gives values to the x-axis starting from 1, 2, 3, up to y coordinates.
MATLAB
y=[100,200,300,400,500]
plot(x,y)
grid on
|
Output :

Example 3: Draw more than 1 line on the same graph with axis names:
MATLAB
x=[10,20,30,40,50]
y1=[100,500,200,100,0]
y2=[400,100,0,200,300]
y3=[200,300,400,100,500]
plot(x,y1,x,y2,x,y3)
grid on
xlabel('x')
ylabel('y')
|
Output :

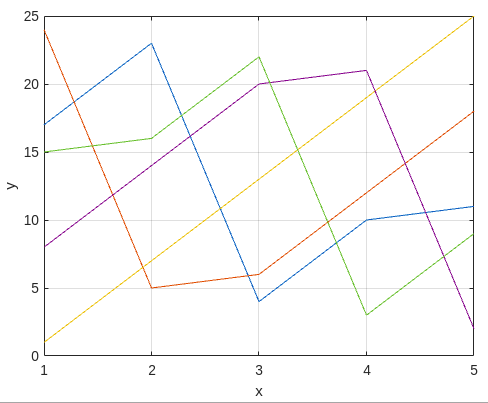
Example 4: Now the value of the y-axis is given as matrix instead of vector:
MATLAB
x=[1,2,3,4,5]
y=magic(5)
plot(x,y)
grid on
xlabel('x')
ylabel('y')
|
Output:
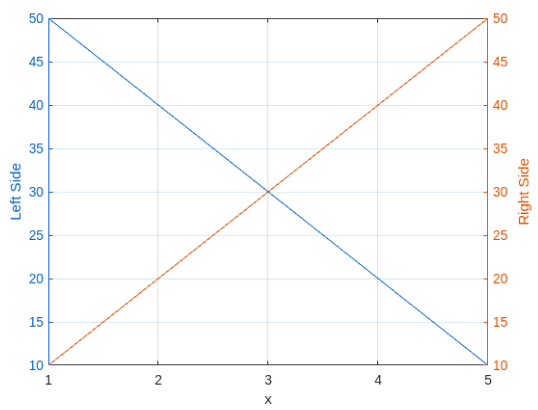
Example 5: Now we plot the graph by using 2 y-axis one is on the left side another is on the right side.
MATLAB
x=[1,2,3,4,5]
y=[50,40,30,20,10]
yyaxis left
plot(x,y)
y=[10,20,30,40,50]
yyaxis right
plot(x,y)
grid on
xlabel('x')
yyaxis left
ylabel('Left Side')
yyaxis right
ylabel('Right Side')
|
Output:
Like Article
Suggest improvement
Share your thoughts in the comments
Please Login to comment...