The Ulam Spiral
Last Updated :
08 Feb, 2018
The Ulam spiral or prime spiral is a graphical depiction of the set of prime numbers. It emphasizes the striking appearance in the spiral of prominent diagonal, horizontal, and vertical lines containing large numbers of primes.
How to construct Ulam Spiral?
The number spiral is constructed by writing the positive integers in a spiral arrangement on a square lattice, as shown.
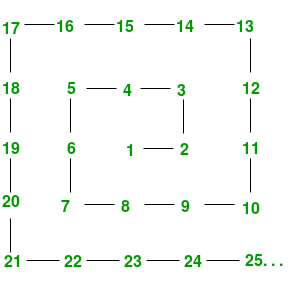
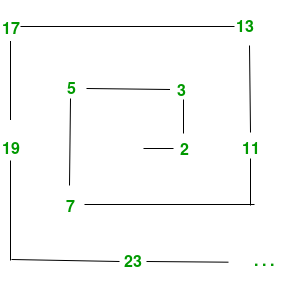
The Ulam spiral is produced by specially marking the prime numbers—for example by circling the primes or writing only the primes or by writing the prime numbers and non-prime numbers in different colors—to obtain a figure like the one below.
Code to Generate Prime Number
#importing the required libraries
import math
import itertools

def primes():
    yield 2
    primesSoFar = [2]
    for candidate in itertools.count(3, 2):
        for prime in (i for i in primesSoFar if i  100:
            break
        print(p)

if __name__ == "__main__":
    main()
But that’s not what we wanted. We wanted to generate Ulam spiral, isn’t it?
Its just getting started so the next step is to generate the prime spiral ; to generate one pixel for each natural number, black or white, depending on whether the number is a prime or not. To generate such plot we will use the matplotlib library of python and numpy for mathematical purposes.
So now the question is how should we approach? It’s quite a simple idea. First we have to generate a array of prime numbers of size ‘n^2’. Then create an array of boolean values: 1 for prime, 0 for composite of same size ‘n^2’. The next step should be convert the second array of boolean values to spiral the values clockwise out from the center and to do so we can proceed with the following steps :
1: Generate an array with elements containing ‘n*n’ and then reshape the array to matrix form of order ‘n X n’.
2: Create another empty list then append the first row of the matrix generated in step 1.
3: Remove the first row (the one we’ve just appended to spiral).
4: Rotate the rest of the array anticlockwise.
5: Make a flat array of indices spiralling into the array.
6: Index into a flattened version of our target array with spiral indices.
And after following the steps you are good to go and lastly just plot the array we got after the following operations using matplotlib as mentioned above. The code is given down below still i would highly recommend you to try this out first by yourself then dig in to the code.
import numpy as np
import matplotlib.pyplot as plt
import matplotlib.cm as cm
def make_spiral(arr):
nrows, ncols= arr.shape
idx = np.arange(nrows*ncols).reshape(nrows,ncols)[::-1]
spiral_idx = []
while idx.size:
spiral_idx.append(idx[0])
idx = idx[1:]
idx = idx.T[::-1]
spiral_idx = np.hstack(spiral_idx)
spiral = np.empty_like(arr)
spiral.flat[spiral_idx] = arr.flat[::-1]
return spiral
w = 251
primes = np.array([n for n in range(2,w**2+1) if all(
(n % m) != 0 for m in range(2,int(np.sqrt(n))+1))])
arr = np.zeros(w**2, dtype='u1')
arr[primes-1] = 1
arr = make_spiral(arr.reshape((w,w)))
plt.matshow(arr, cmap=cm.binary)
plt.axis('off')
plt.show()
|
For a better understanding of this mathematical concept prefer refer to this video.
Like Article
Suggest improvement
Share your thoughts in the comments
Please Login to comment...